What it does
Tracer enables teams to resolve incidents quickly without sacrificing fix quality or team capacity. With Tracer, you can:- Stop investigating, start fixing. When an alert fires, Tracer immediately pulls context from your observability tools, infrastructure, and knowledge bases. It checks recent deploys, queries logs and metrics, builds multiple root cause hypotheses, and tests them in parallel. By the time you open your laptop, you already know what broke and why.
- Ship the right fix, not the fast one. When you’re on-call and the pressure’s on, you ship the patch that makes the alert go away. Tracer takes investigation off your plate so you have the time and context to fix the actual problem instead of papering over it.
- Give everyone the context that’s usually stuck in one person’s head. Complex pipelines often need the engineer who built them to debug them. Tracer surfaces the same depth of analysis – what failed, what changed, what caused the cascade – so whoever’s on-call can understand root cause without needing to page the one person who just knows.
How it works
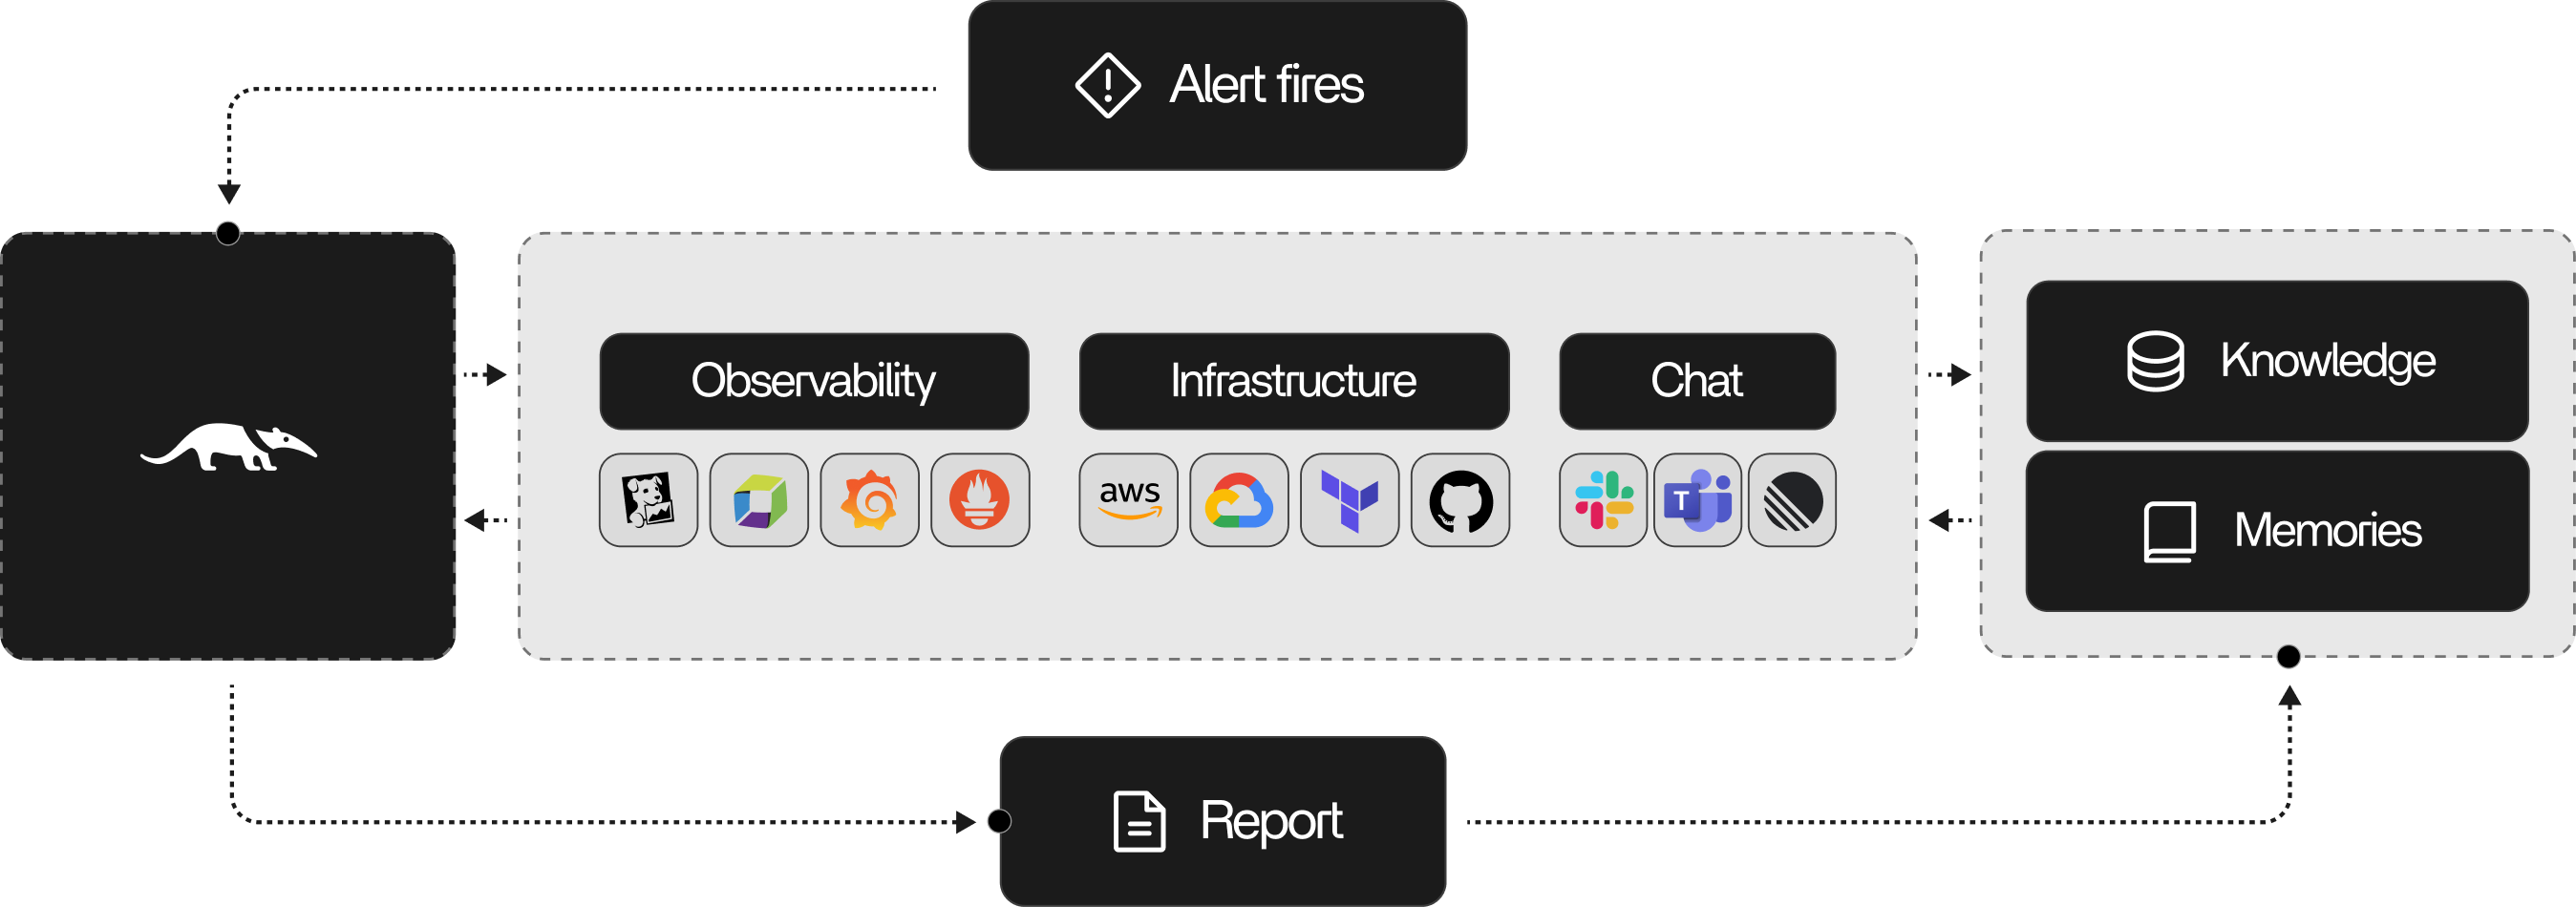
When an alert fires, Tracer autonomously:- Ingests the alert. Picks up alerts from your metrics, logs, traces, or incident systems and normalizes them into a single investigation.
- Assembles context. Pulls in service ownership, dependencies, recent deploys, config changes, and baselines.
- Frames the problem. Identifies impacted components, plausible failure modes, and investigation objectives.
- Investigates in a loop. Plans queries, executes them against your observability and production tooling, and synthesizes evidence into evolving hypotheses.
- Decides when to stop. Evaluates hypothesis confidence, remaining uncertainty, and whether further investigation is likely to change the outcome.
- Delivers a report. Sends likely root causes, supporting evidence, and recommended next actions to Slack, PagerDuty, or wherever your team communicates.