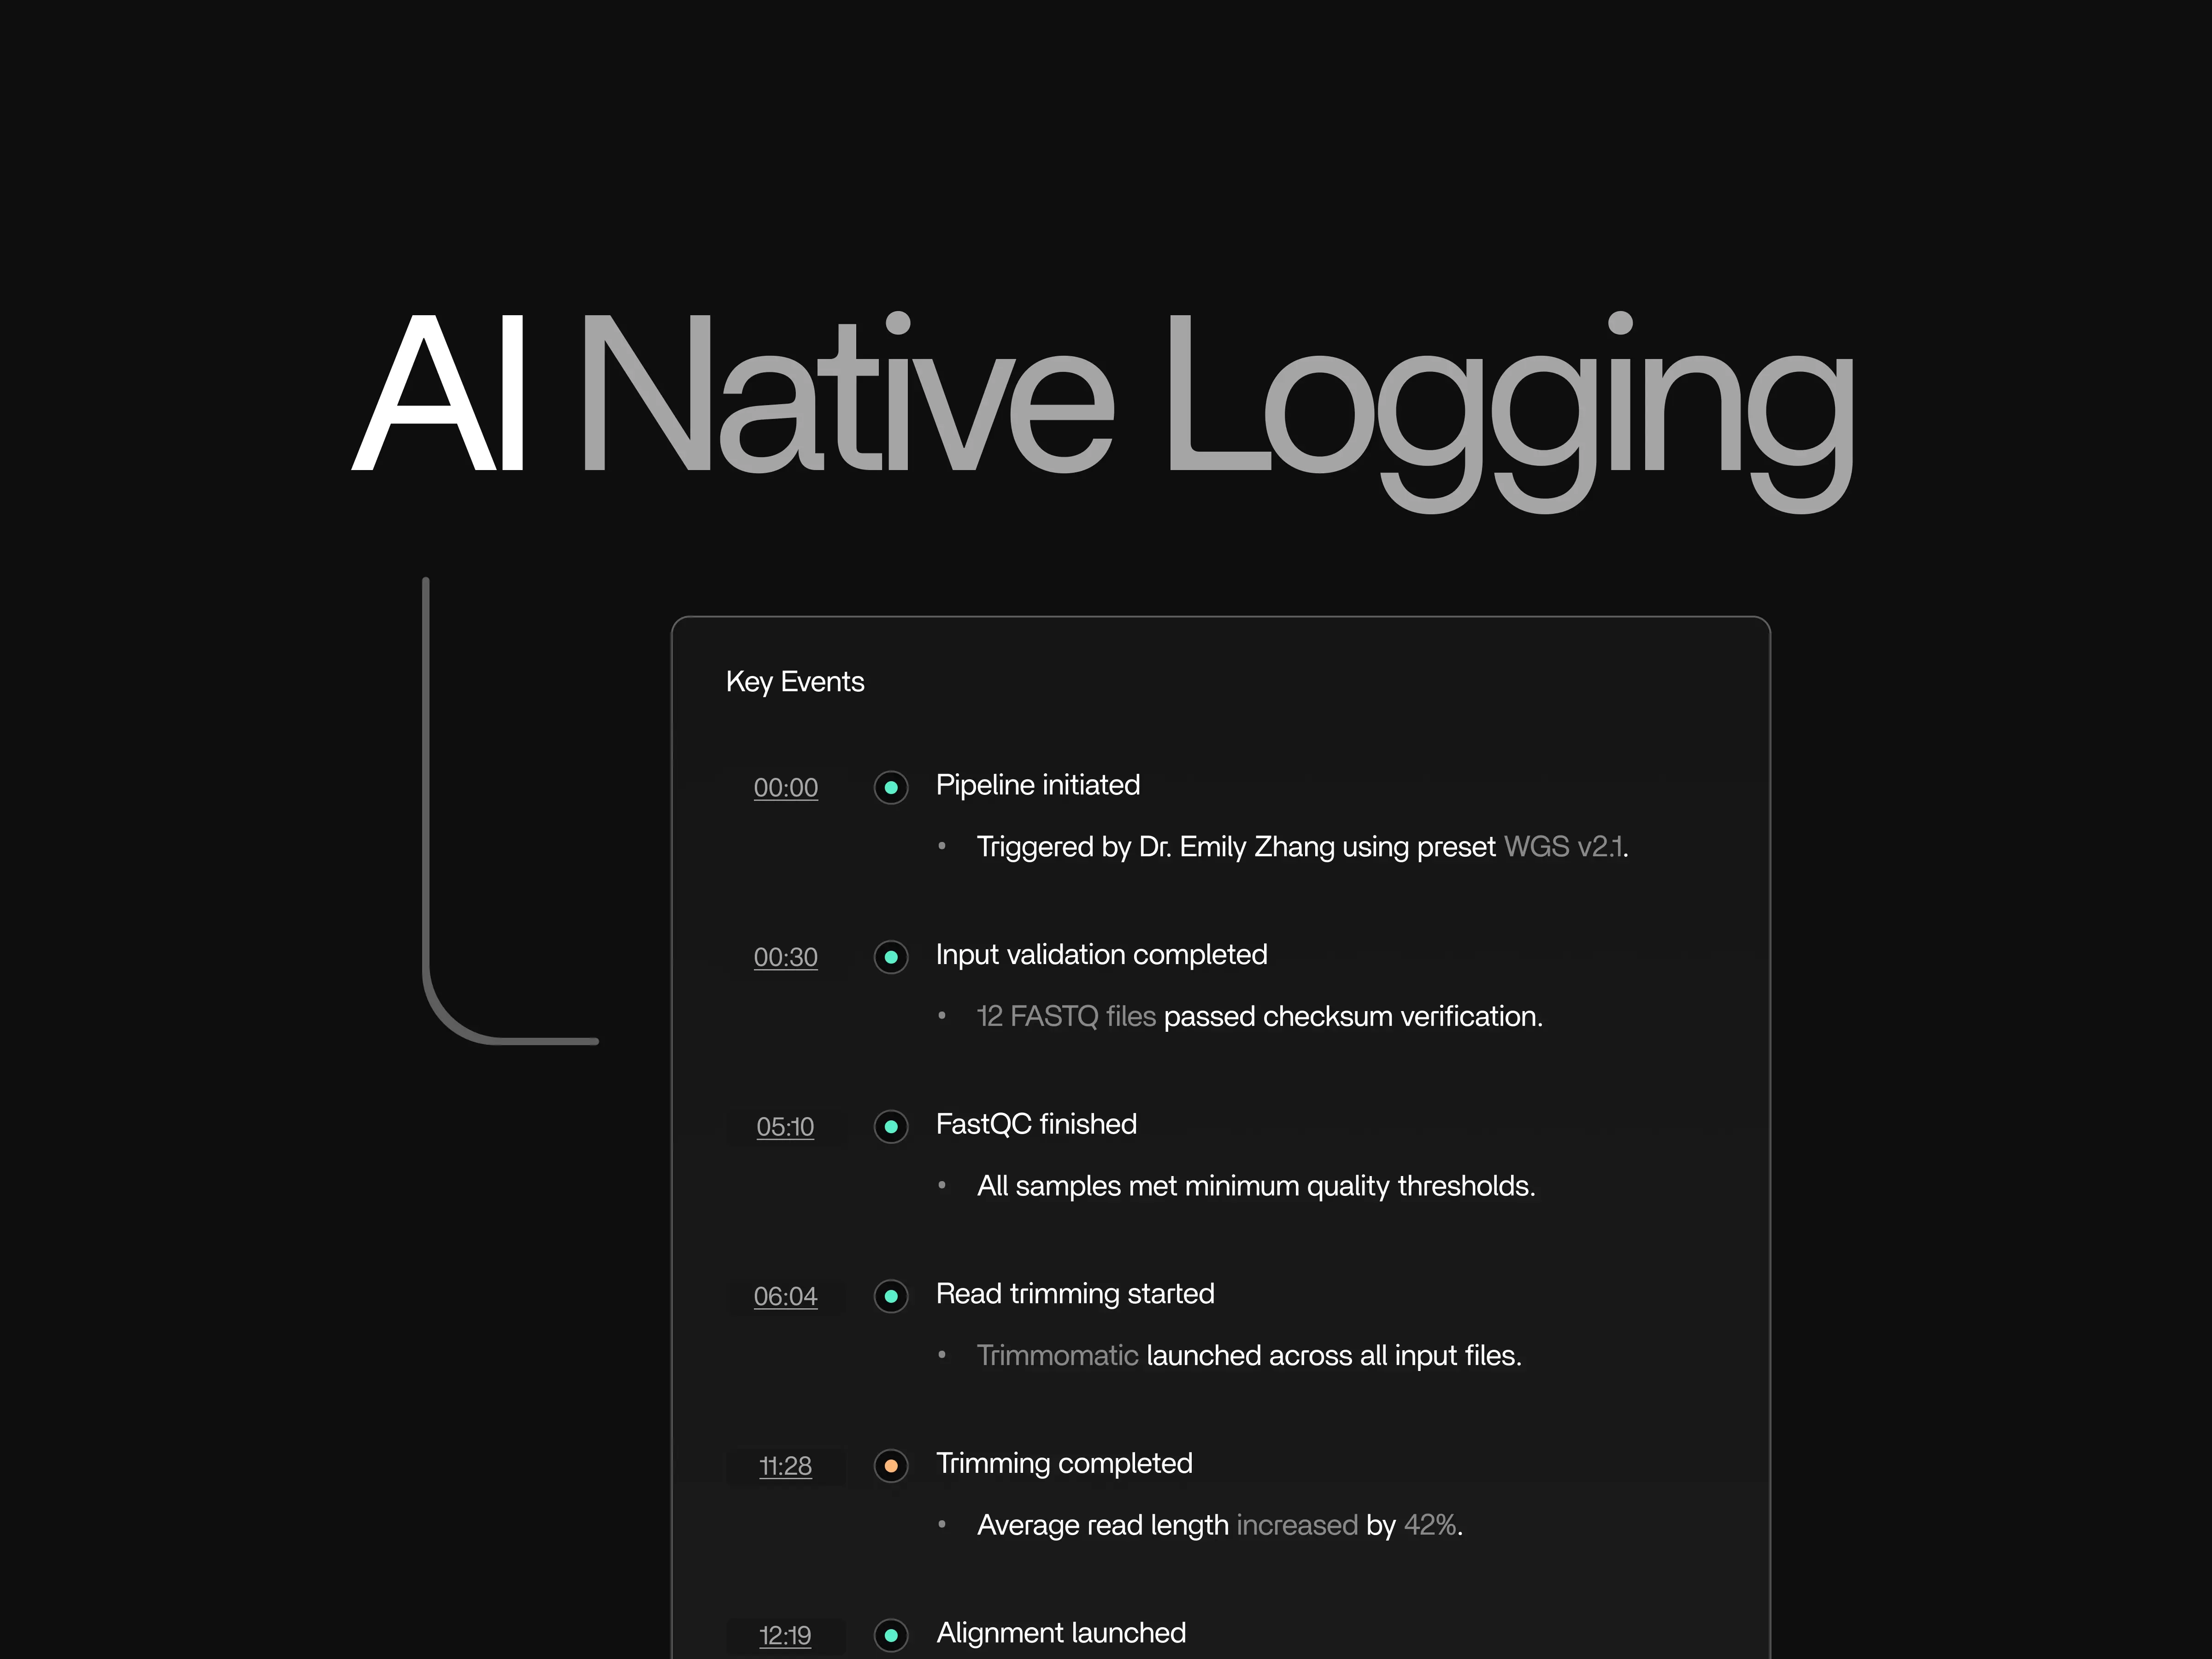
76% Faster Pipeline Debugging With AI Native Logging
How Tracer transformed pipeline debugging with centralized observability and AI-powered root-cause analysis
What we did
Reduction in debugging time
Active productivity regain
Saved per developer per year
76% Faster Pipeline Debugging With AI Native Logging
In this case study
“Tracer's centralized observability platform transforms pipeline debugging by consolidating logs and enabling real-time root-cause analysis”
Debugging Performance
Overview
Tracer's internal development team faced the same debugging challenges that plague data pipeline teams everywhere. Through building and validating our own observability platform, we achieved measurable improvements in debugging efficiency that translate to significant productivity gains for research teams.
“Reducing debugging time from 20 minutes to 5 minutes fundamentally transforms how our research teams approach pipeline failures and accelerates scientific discovery” — Vincent Hus, CEO and founding engineer at Tracer
Challenge
Debugging data pipelines often means going through scattered logs, manually navigating CloudWatch, or SSH'ing into EC2 instances. This leads to:
This problem intensifies in AWS Batch runs, forcing researchers to sift through failures across multiple instances.
Internal Resolution
Frustrated with this time-consuming process, we at Tracer build an observability platform with a unique technology that offers:
This allows us to give researchers real-time warnings on their active pipelines, helping them avoid failures and keep everything running smoothly.
And if a pipeline does fail, we pinpoint exactly where it broke, so researchers can quickly focus on the right issue and make the changes needed to get their next run working successfully.

Tracer's batch visualization interface showing pipeline failures and real-time debugging insights, enabling rapid identification and resolution of issues across distributed workflows.
Proof of Value
We validated this with real-world tests to show measurable impact. Through focus groups, we compared debugging efficiency in two scenarios: without and with Tracer's centralized observability. The teams worked through the four main phases of debugging: identifying pipeline failures, finding relevant logs, locating errors, and deciding next steps.
The result left us without any doubt and demonstrate reductions in every specific behaviours in the flow:
faster to pinpoint the failing pipeline step due to the tool visualiser and pipeline health status
reduction in time to locate relevant logs
faster to locate errors in the logs with the help of AI native logging
faster deciding next steps by timesaving by log parsing
The controlled debugging scenarios confirmed measurable and significant efficiency gains of 76% in total, bringing a 20 minute debugging time down to only 5 minutes.
As Tracer translates into real productivity improvements by:
Measurable Impact
To make these percentages more tangible, we estimated that for a composite mid-market enterprise in life sciences that runs 100,000 pipelines a month, the use of Tracer's centralized observability could turn more than 38,000 hours into time spent on higher-value work like algorithm development, innovation, and accelerating discoveries.
Takeaway
Tracer's centralized observability platform transforms pipeline debugging by consolidating logs, persisting data through crashes, and enabling real-time root-cause analysis. This leads to significant reductions in time-to-resolution:
With Tracer, organizations can stop losing time to scattered logs and failed pipelines and instead focus on delivering science faster, at lower cost, and with greater confidence.
“The centralized observability platform has completely eliminated the frustration of hunting through scattered logs. Our team can now focus on innovation rather than infrastructure debugging.”— Arne Broeckaert, Chief of Staff at Tracer

