If you have not yet run a pipeline, please refer to the quickstart to get started.
Accessing Task Status
Navigate to Pipelines Overview
Open the Tracer dashboard and select the “Pipelines” tab next to “Overview”. This will show you all the pipelines that have been run.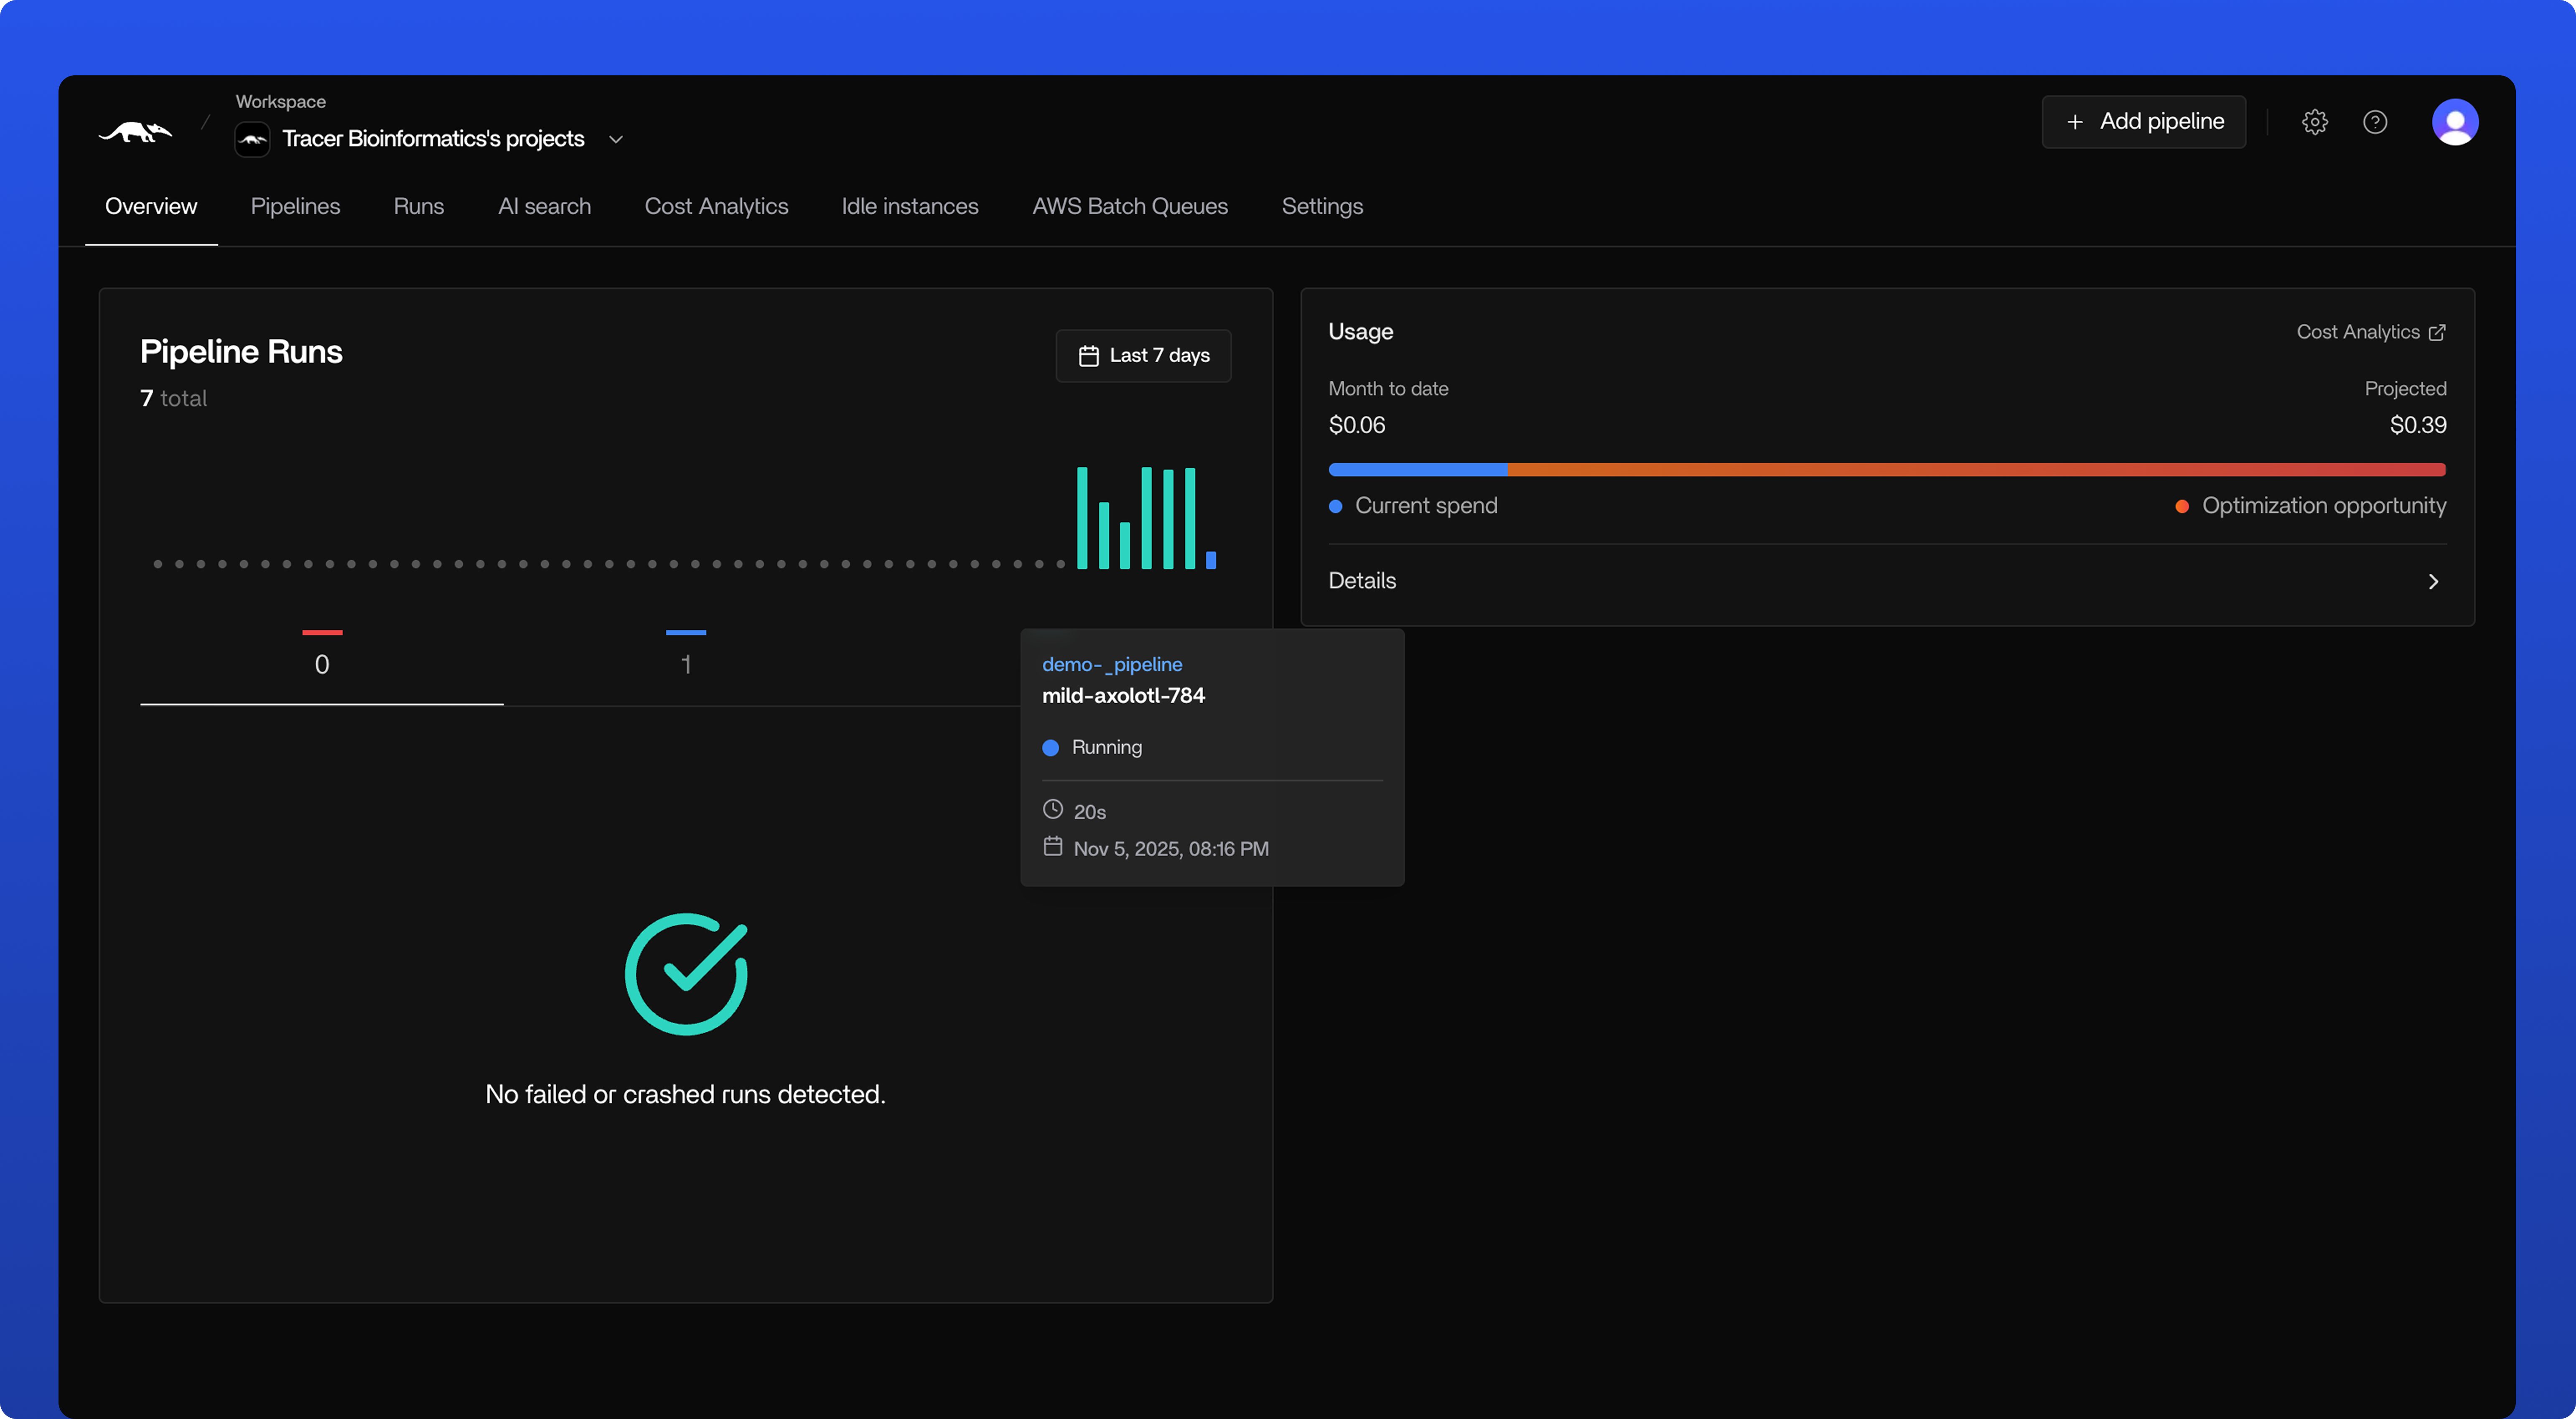
Go to your Specific Pipeline
Access your specific pipeline by clicking on the pipeline name. You can recognize the pipelines which are currently running by the blue dot next to the pipeline name.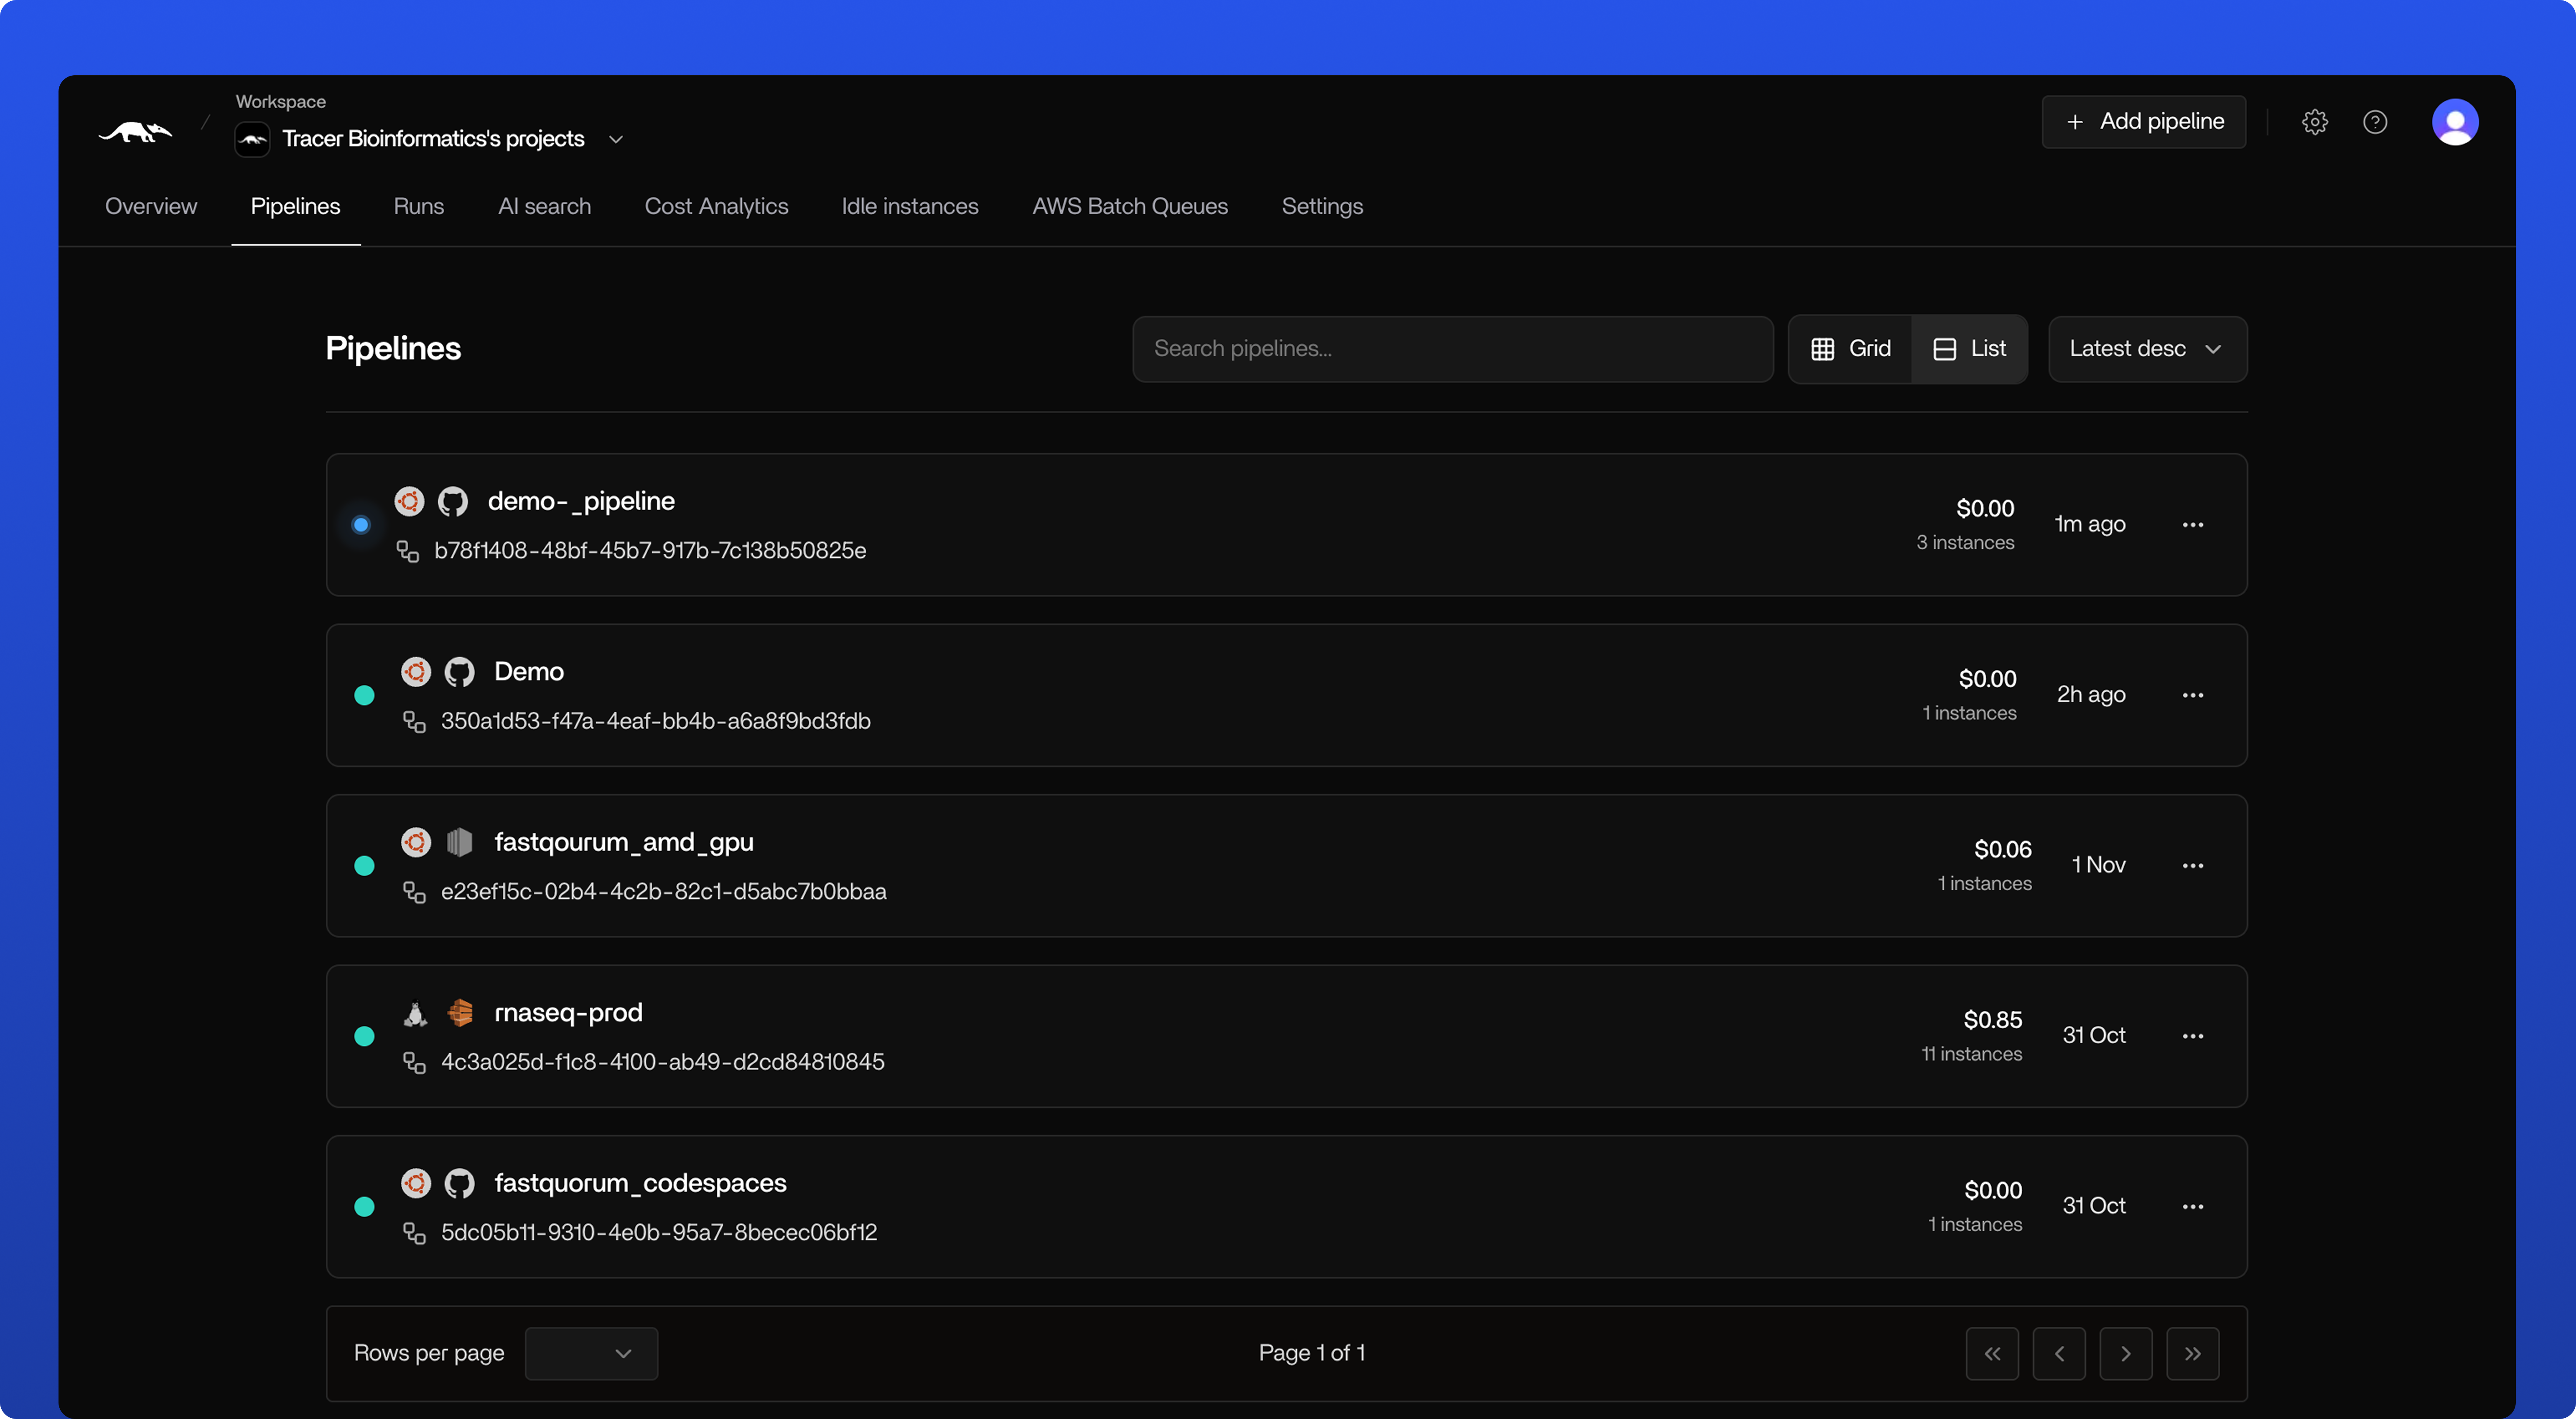
Select the Correct Run
As you will most likely check the current or latest run of the selected pipeline, you can click the blue link “Latest Run” to go to the latest run.If you are searching for an older run, you can click on the “Pipeline Runs” box in the bottom left corner of the screen. This will show you all runs, where you can select the run you are looking for.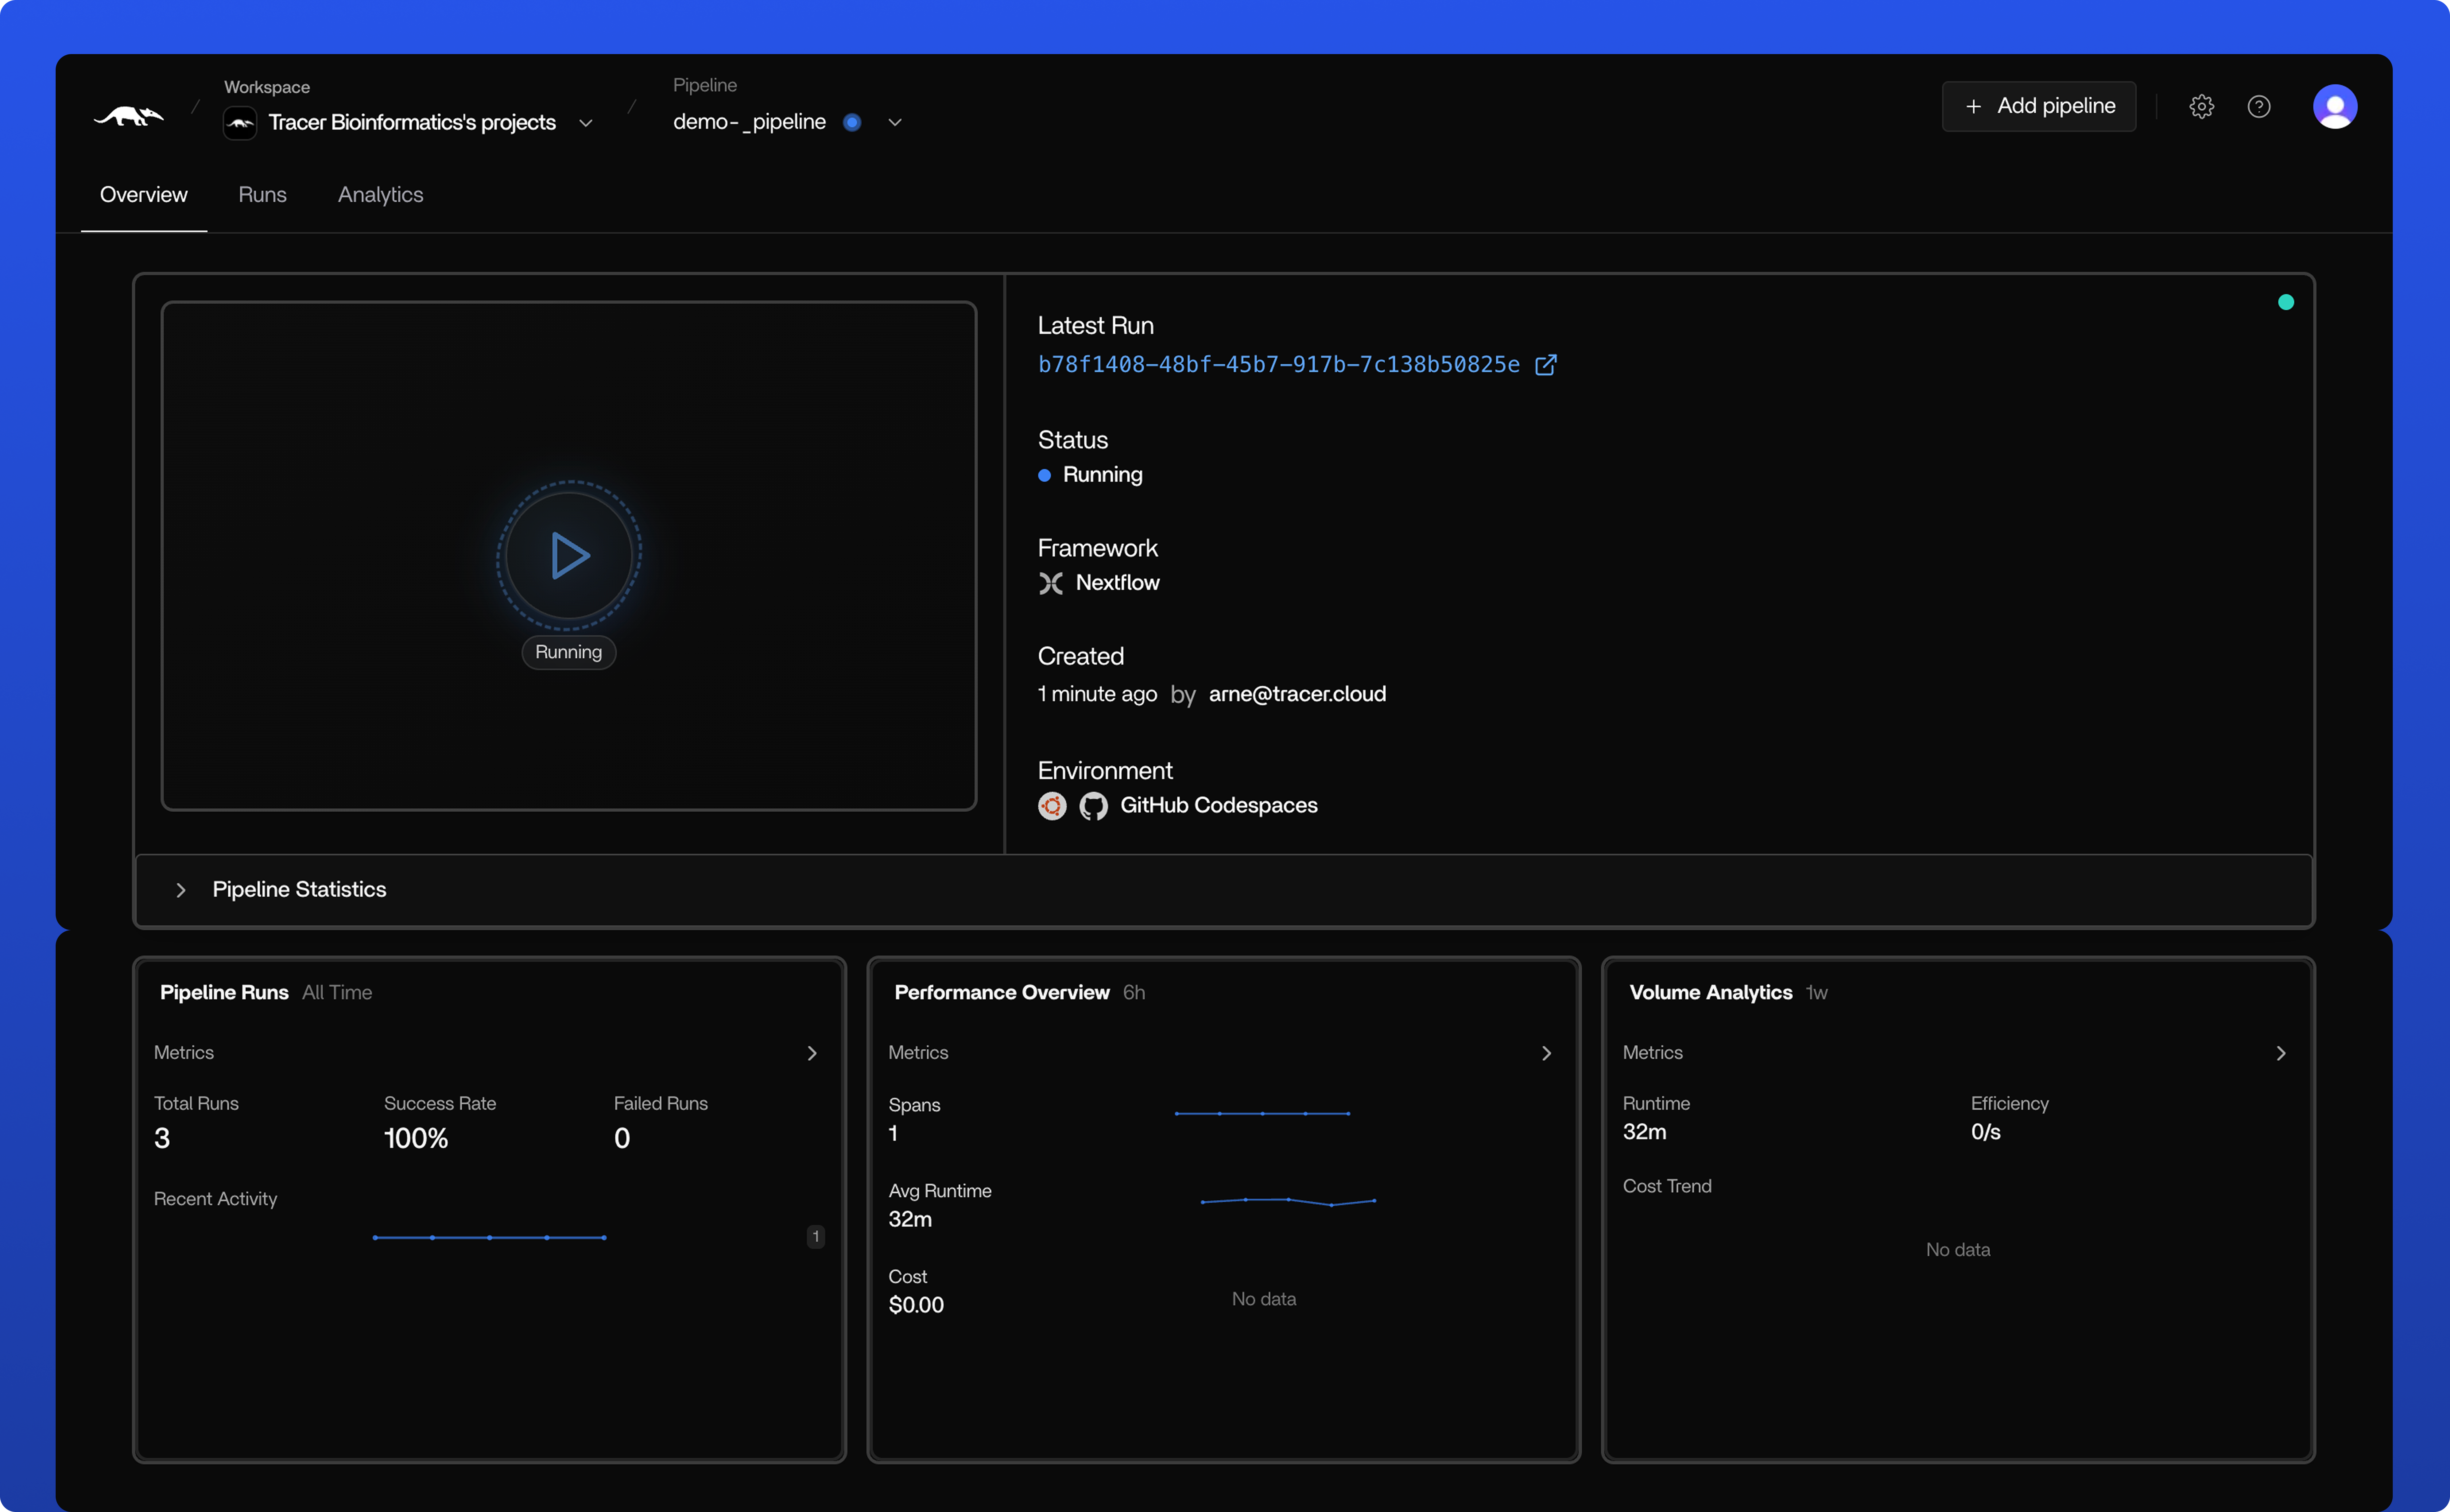
Navigate to Tools
Here, you get the first high-level overview of the pipeline run. You can see the main metrics, runtime and cost as well as the automatic logs with warnings and failure indicators.To go to the task status, click on the “Tools” tab next to “Overview”. This will show you the status of all tasks within this pipeline run.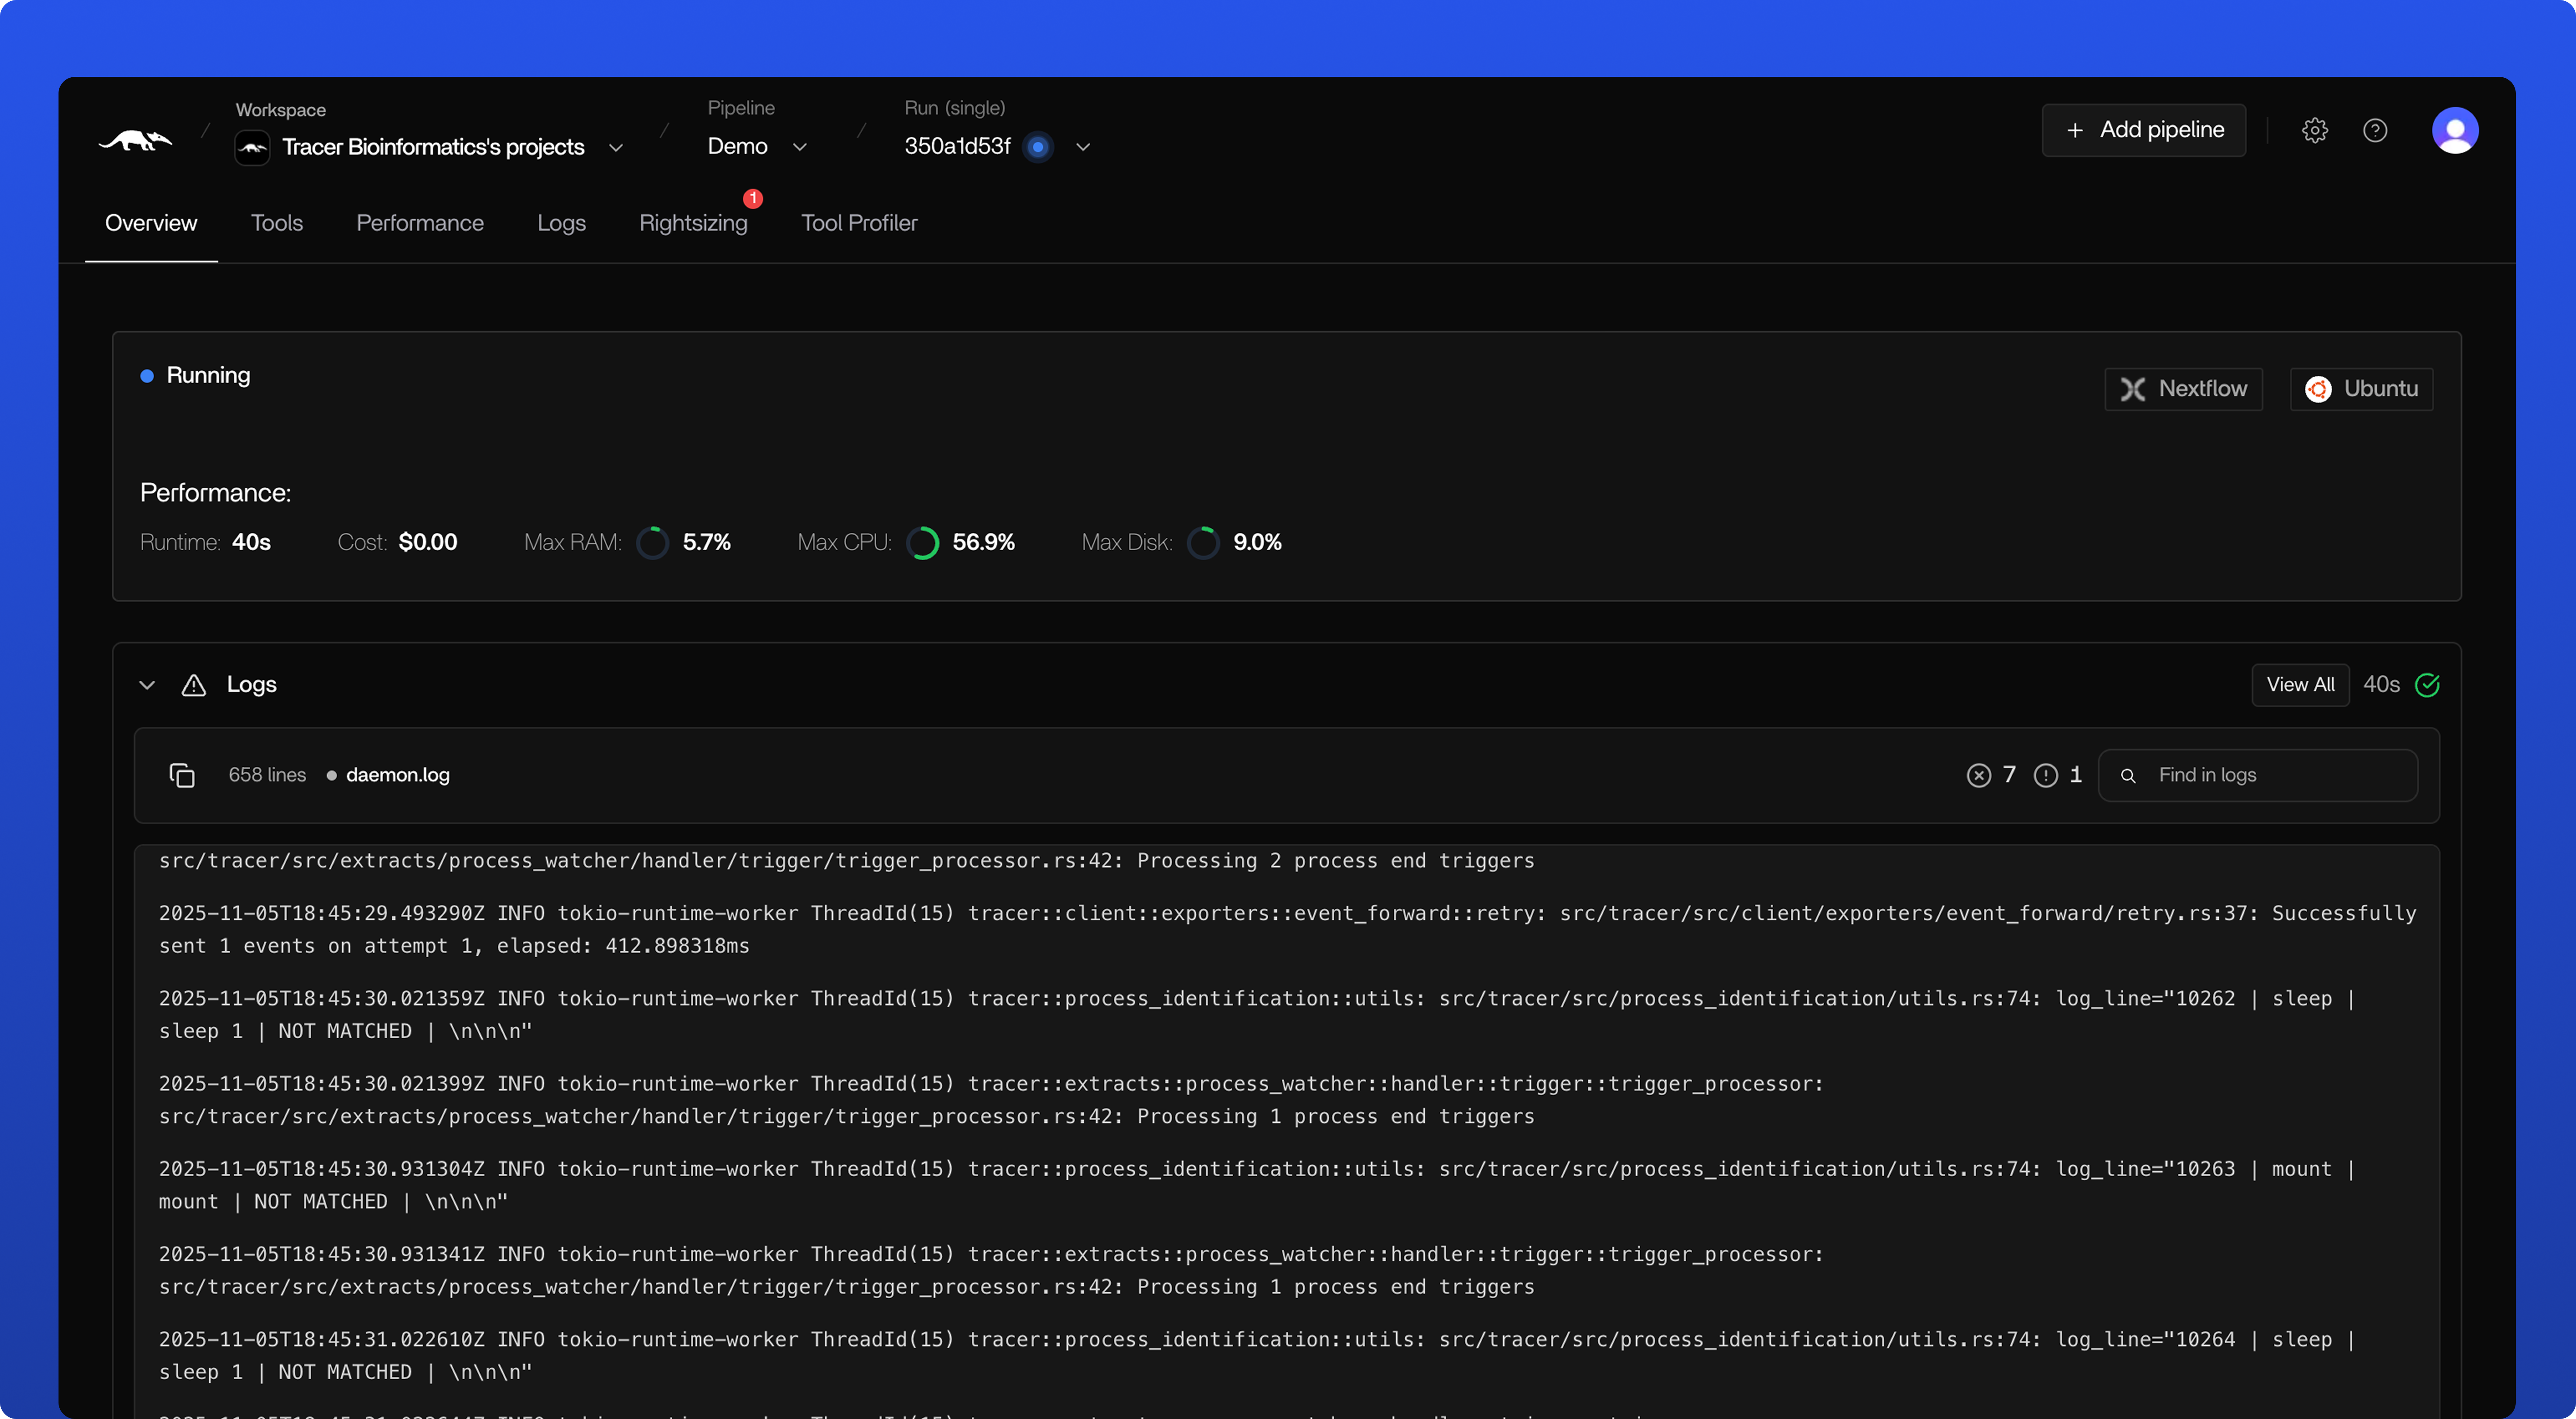
Investigate Task Status
The tool visualizer shows you the status of all tasks within this pipeline run:When hovering over a specific task, you can see the status, runtime, and the exact moment the task started. By clicking the bar, you can dig one level deeper to see the metrics, runtime, cost, and logs with warnings and failure indicators.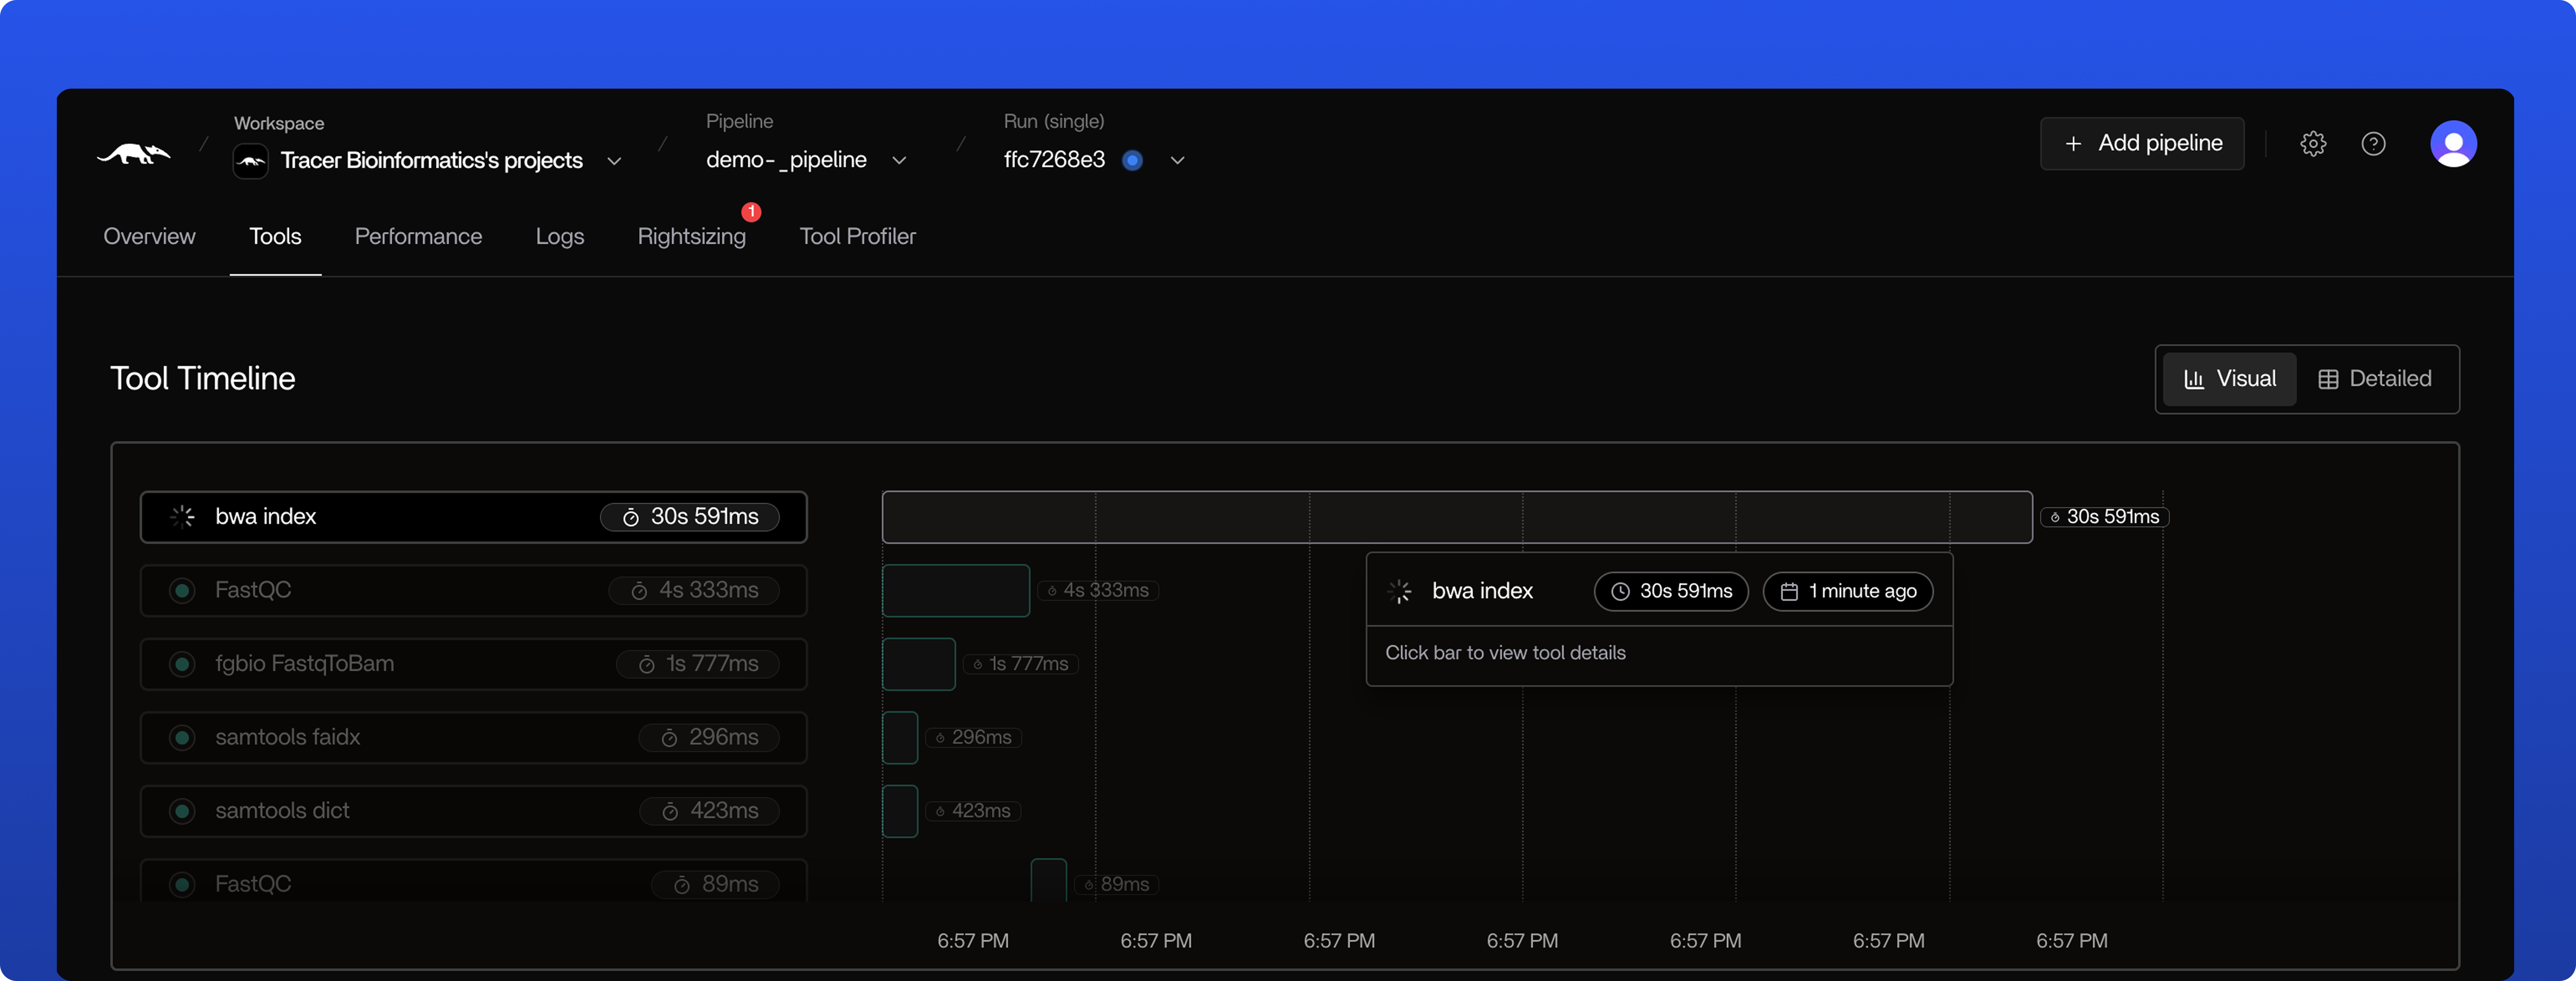
- Bar width indicates the runtime of the task
-
Bar color indicates the status: Grey (running), Green (completed), Red (failed)
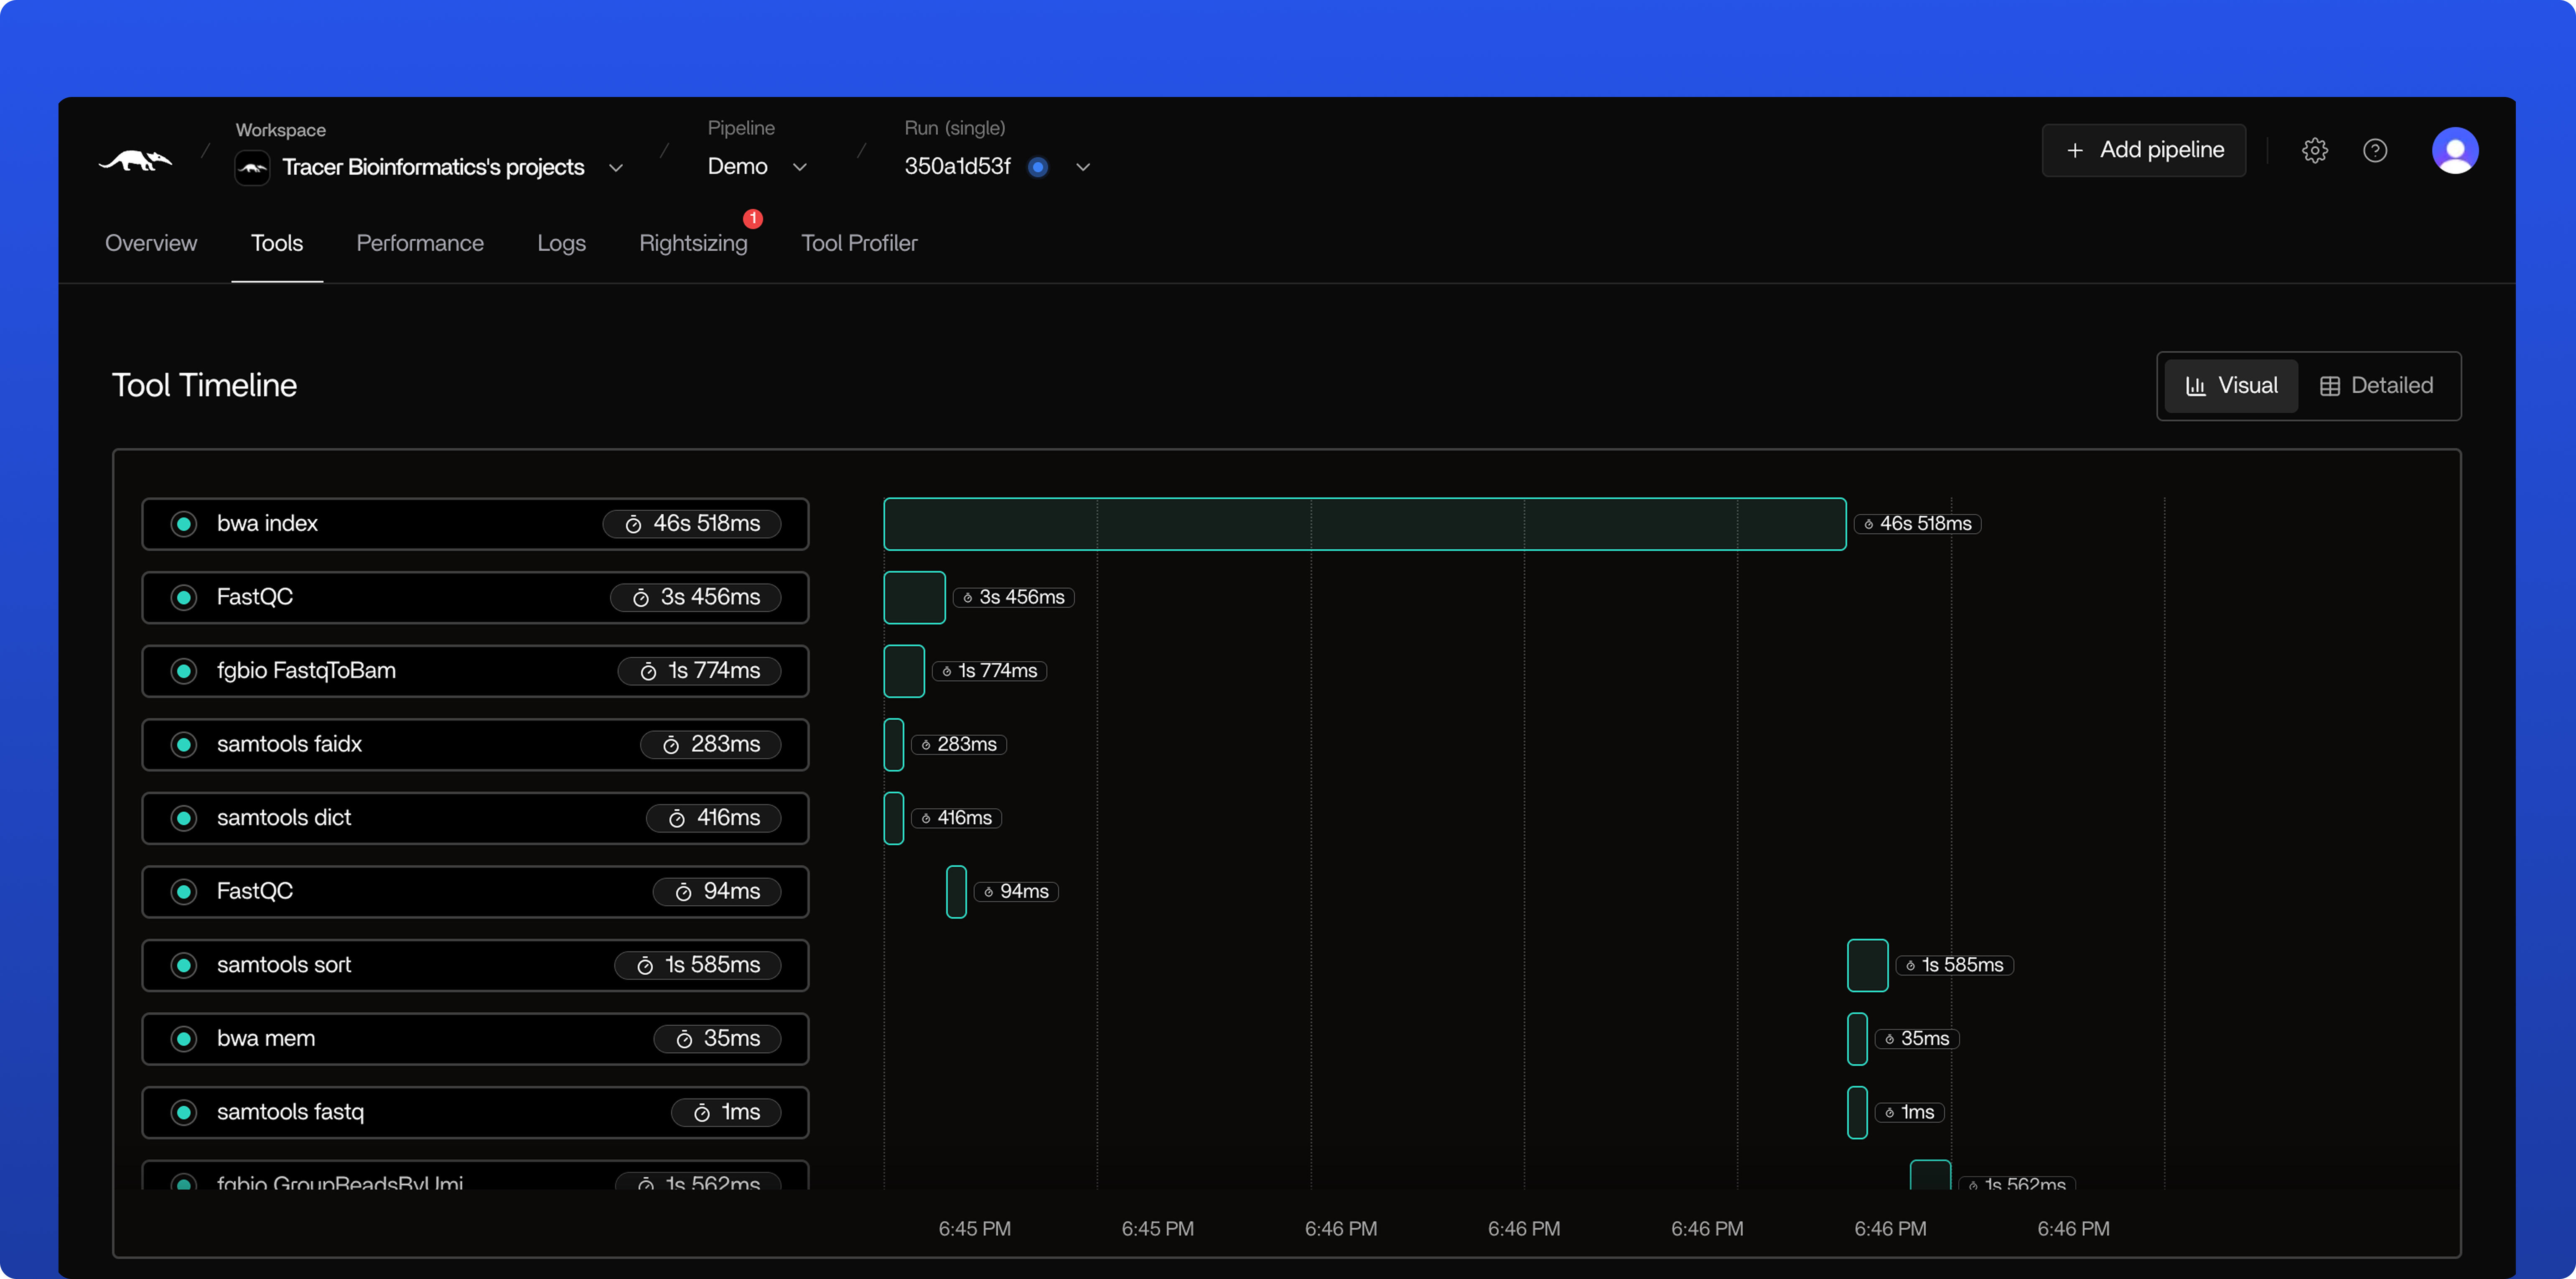
In the image above, all tools are completed as indicated by the green bars.
In the image above, the task is still running as indicated by the grey bar and has been running for exactly 30.591s.
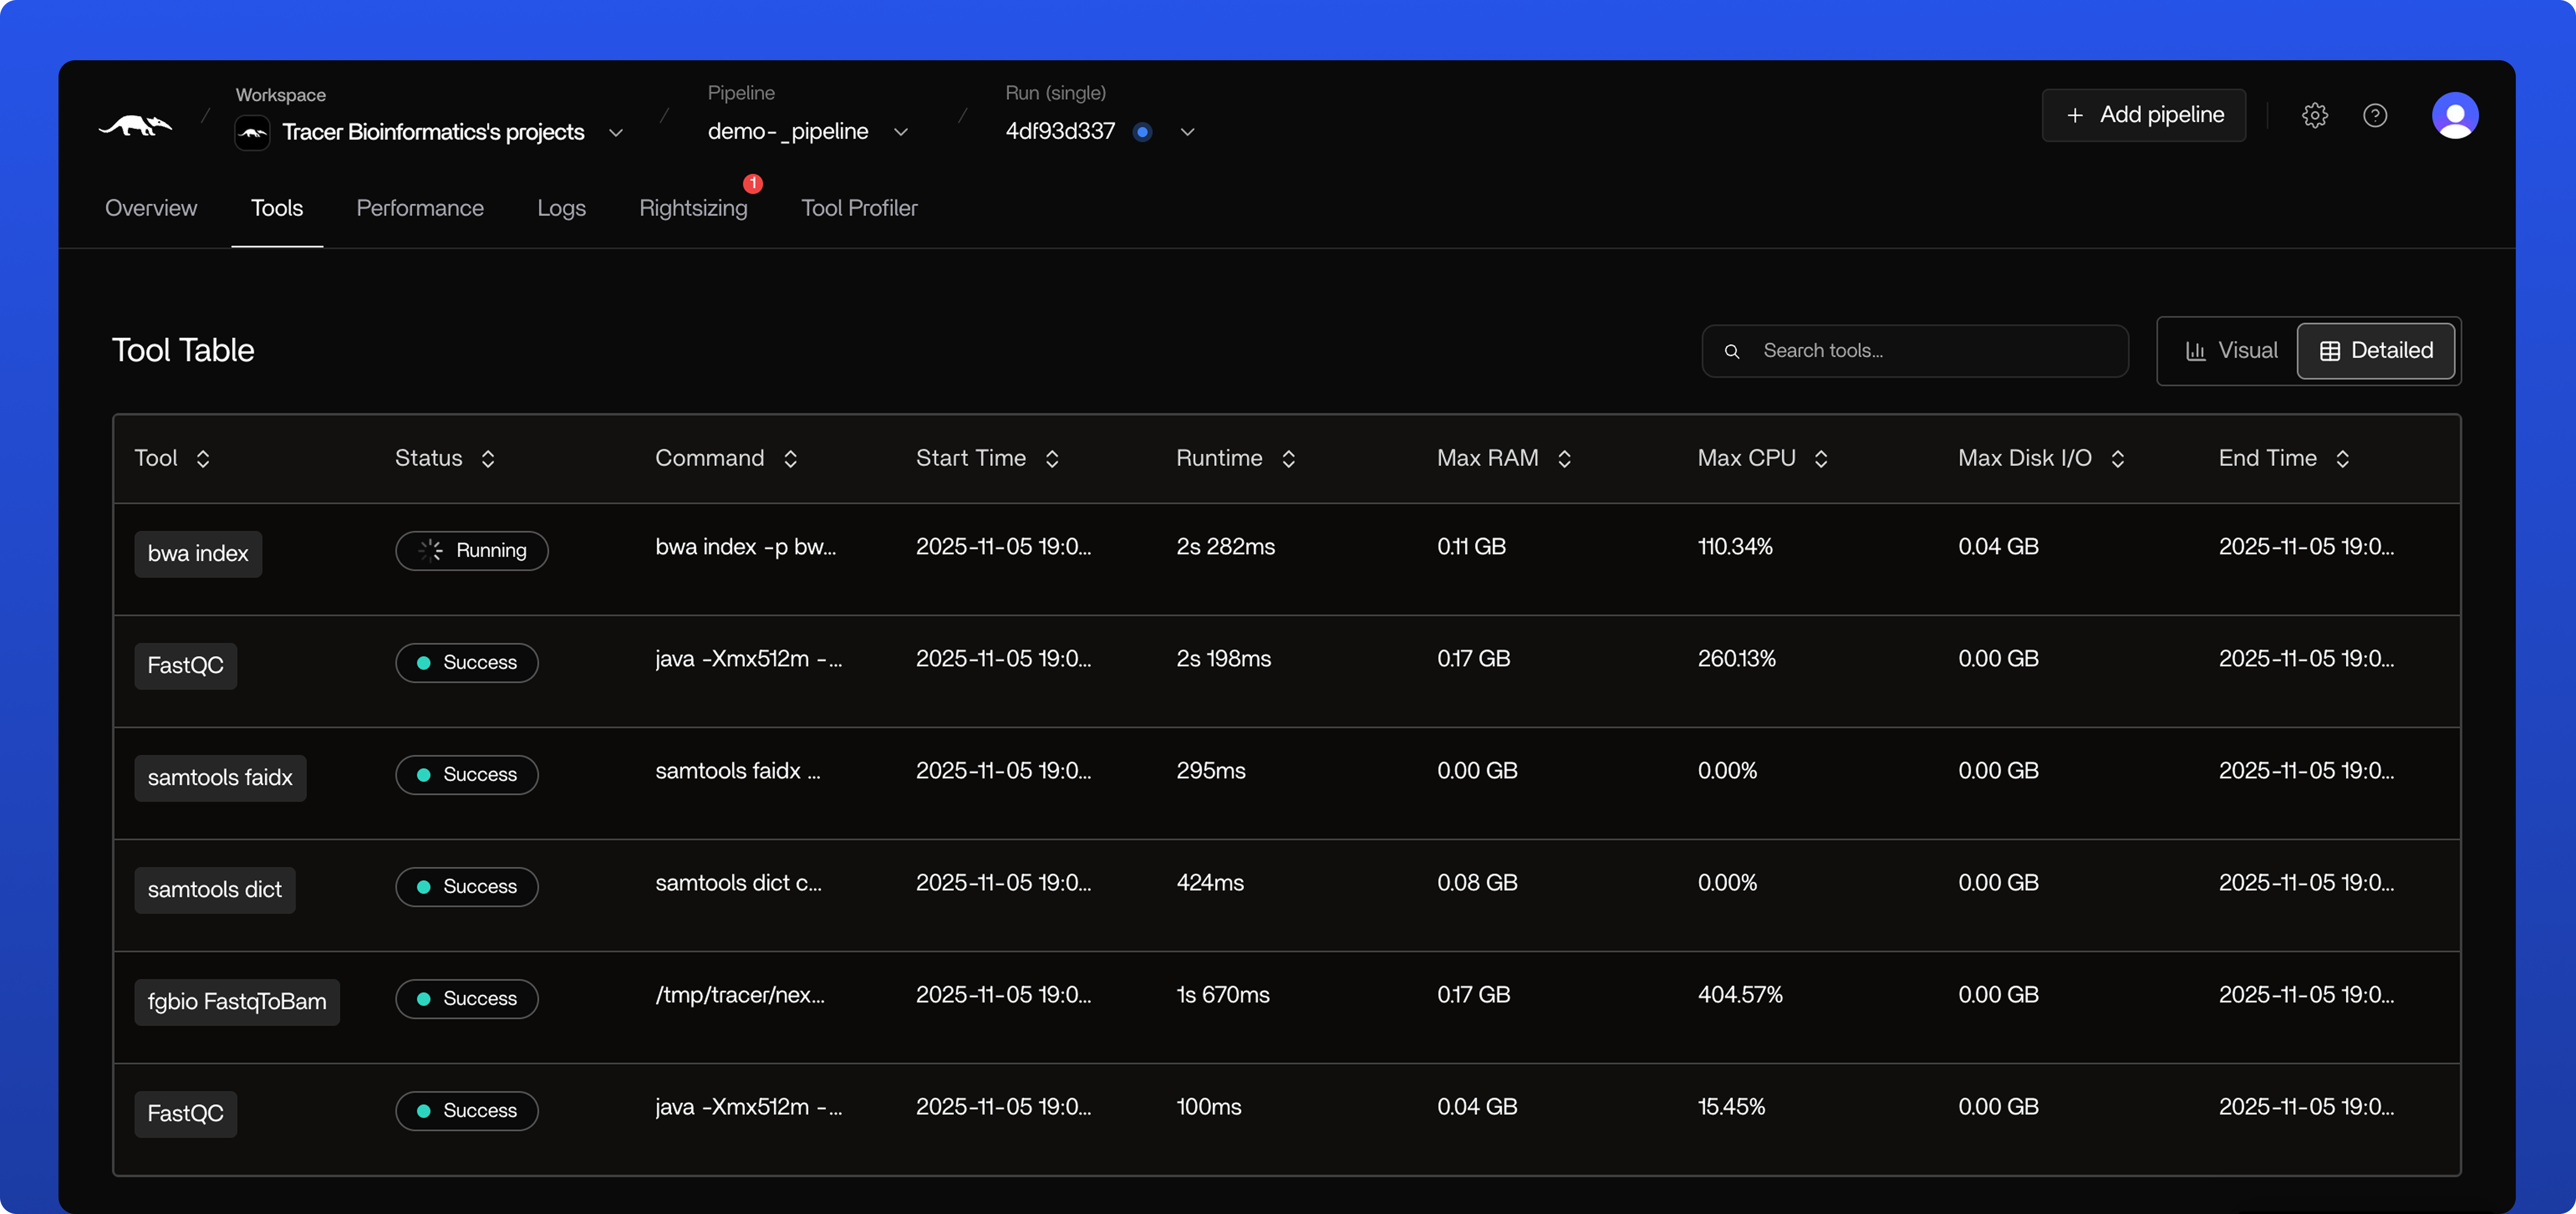
In the image above, you can see that one task is still running as indicated by the “Running” status, while the others are successfully completed.
Tool Specific Metrics
Here, you can see the run-specific metrics including: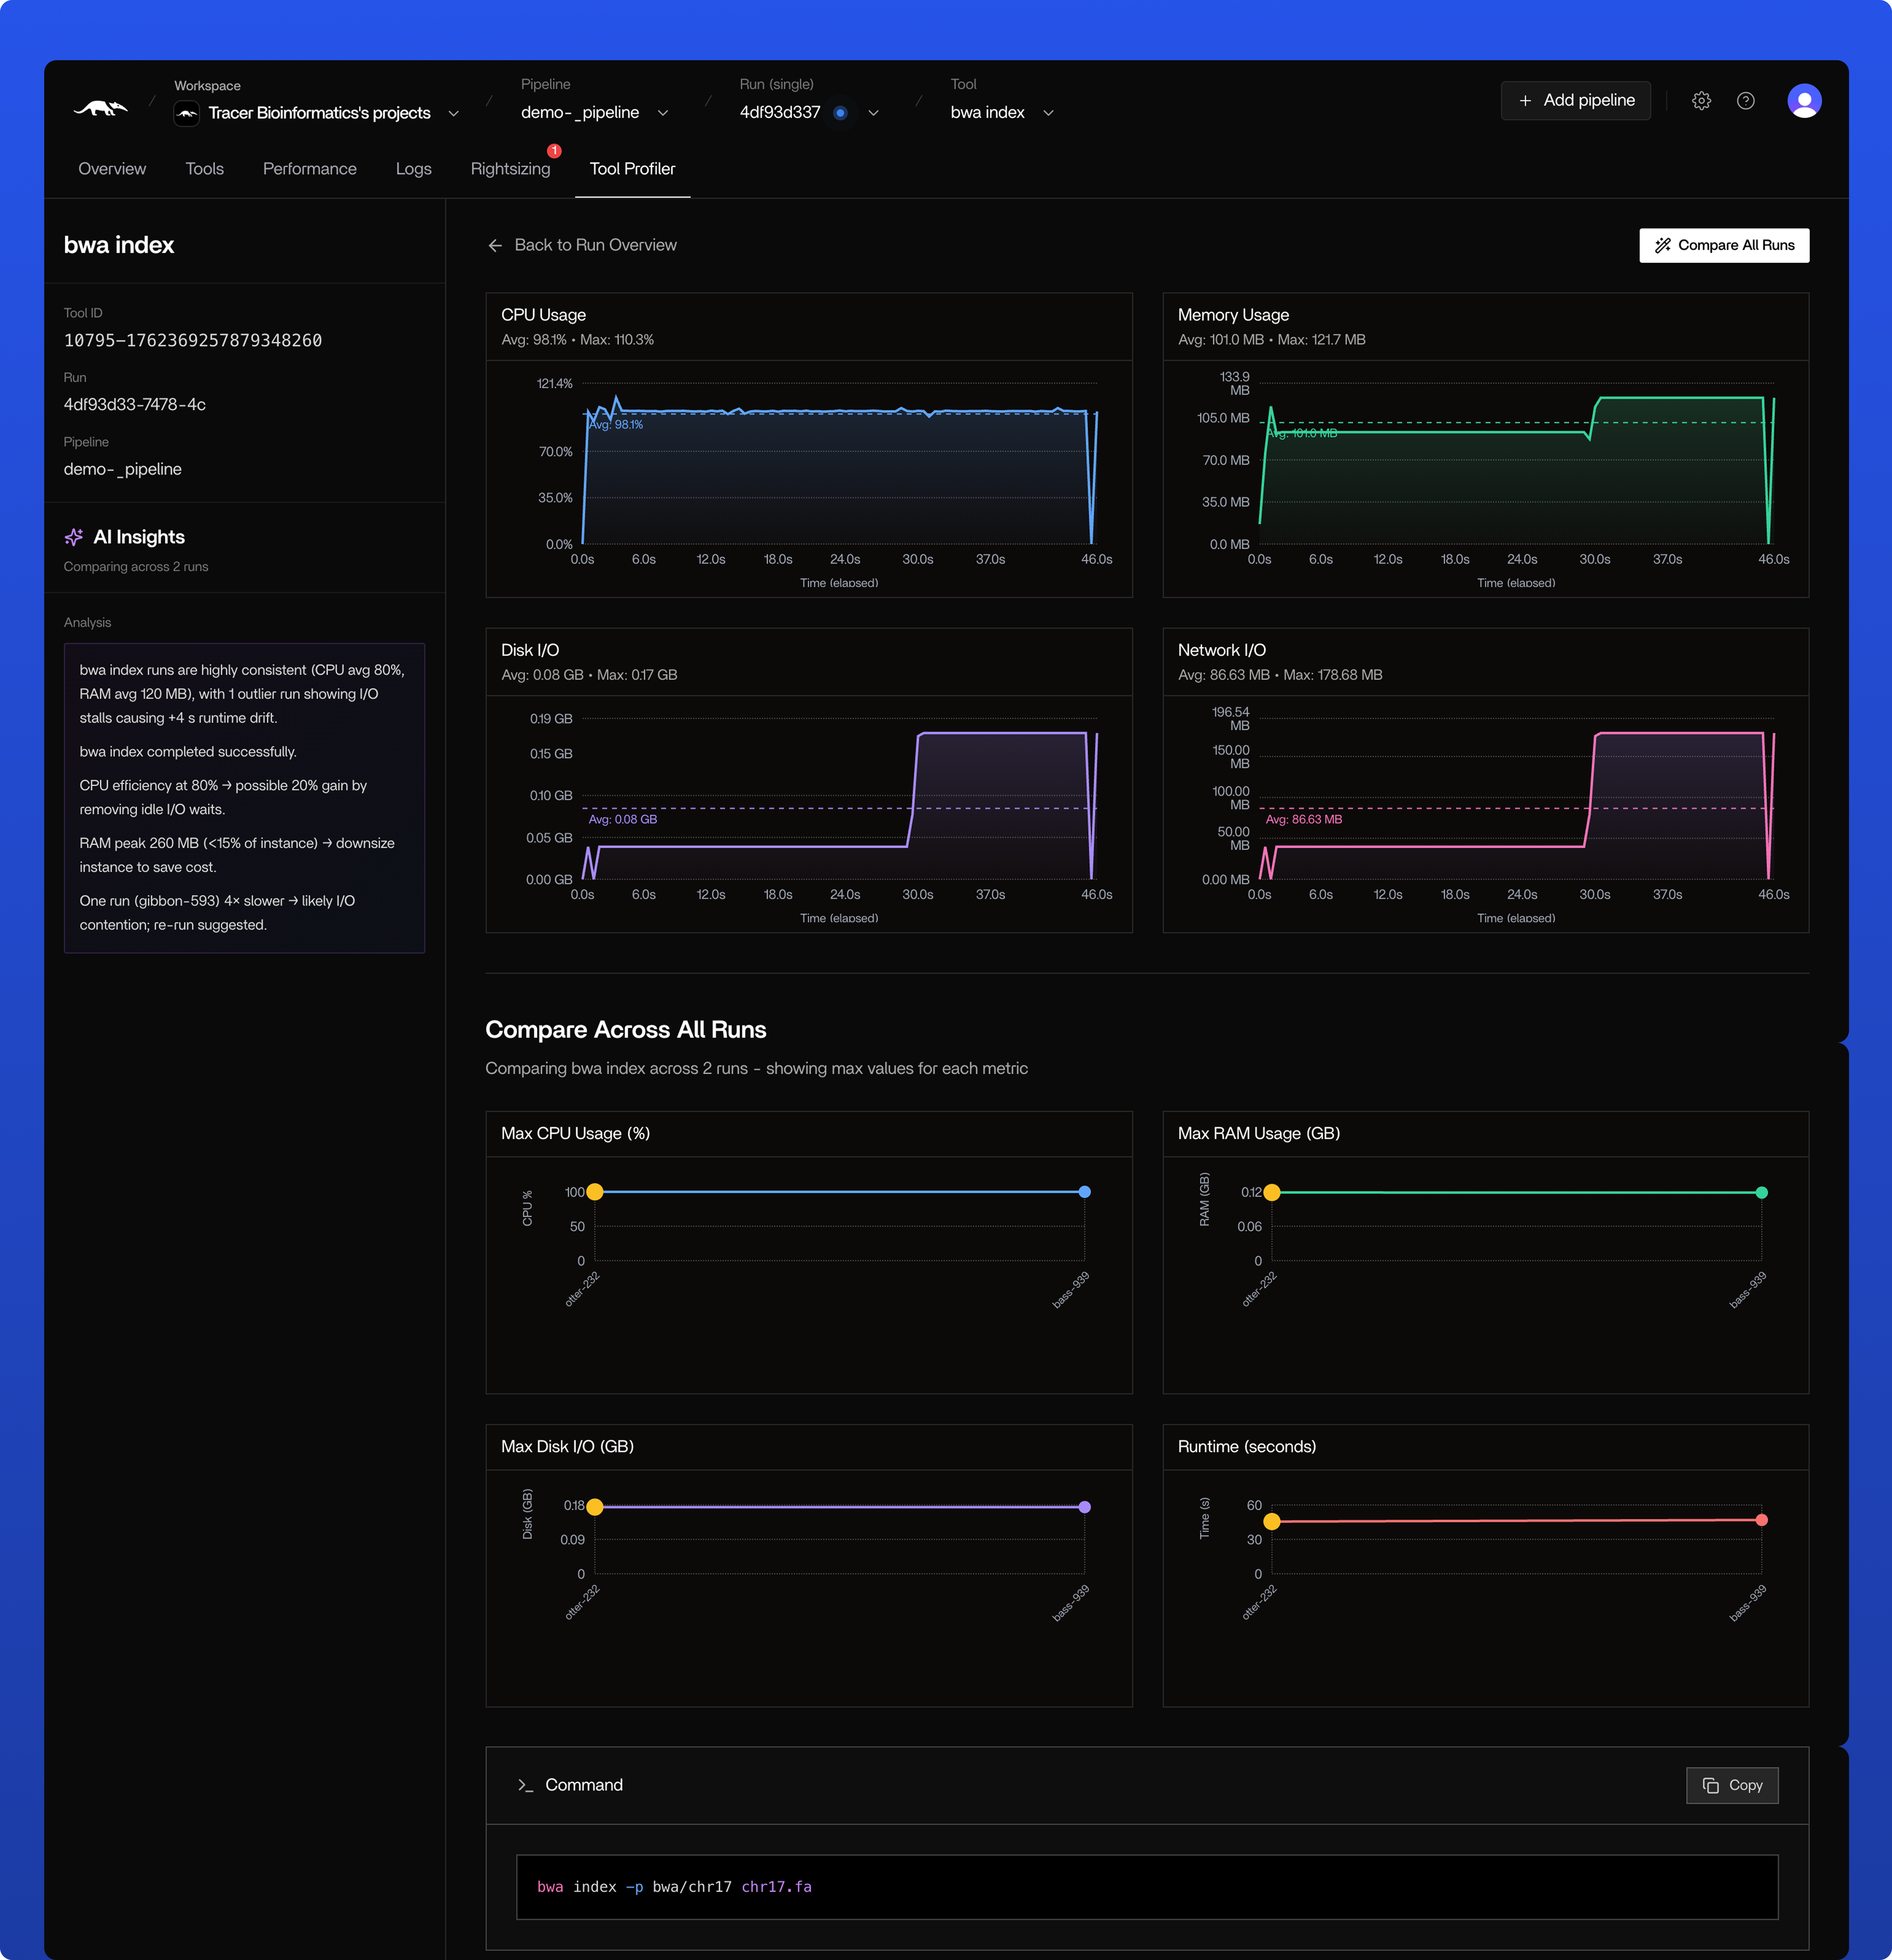
- Tool ID - Unique identifier for the task
- Run Name - Name of the current run
- Pipeline Name - Name of the parent pipeline
- AI Insights - Intelligent analysis and recommendations
- Runtime Metrics - CPU, memory, and I/O usage
Task Status Indicators
Tracer displays tasks with the following status indicators:| Status | Description | Color Used to Indicate |
|---|---|---|
| Running | Task is currently executing | Grey |
| Completed | Task finished successfully | Green |
| Failed | Task encountered an error | Red |
Task Metrics
When viewing a task, you’ll see detailed information including:| Category | Metric | Description |
|---|---|---|
| Status & Timing | Status | Current state of the task (Running, Completed, Failed) |
| Runtime | Total execution time | |
| Start Time | When the task began | |
| End Time | When the task completed (if applicable) | |
| Resource Usage | CPU | Processor utilization |
| RAM Memory | Memory consumption | |
| Disk I/O | Read/write operations | |
| Network I/O | Network traffic | |
| Logs & Debugging | Automatic Logs | Standard output and deep system-level logs captured |
| Warnings | Highlighted warnings and failure indicators | |
| Additional Information | Command | The exact command executed |
| Historical Comparison | Performance comparison with previous runs of this task |
Next Steps
How to get even more out of Tracer’s capabilities:Investigating Task Failures
Learn how to debug failed tasks