Overview
Tracer automatically captures logs, resource metrics, and system call data for every task, even those that fail. Therefore, when tasks fail, Tracer provides detailed information to help you understand what went wrong and how to fix it. Find out how to do this easily below.Previous Knowledge
Before diving in how we can investigate task failures, it is recommended to have a basic understanding of the following concepts:Navigate to Run Overview
See the run details
Viewing Task Status
Monitoring your tasks
Identifying Failed Tasks
Run Overview
When you see the run overview and notice a failed tool, you can click on the “Logs” tab to see the error summary and exit code.
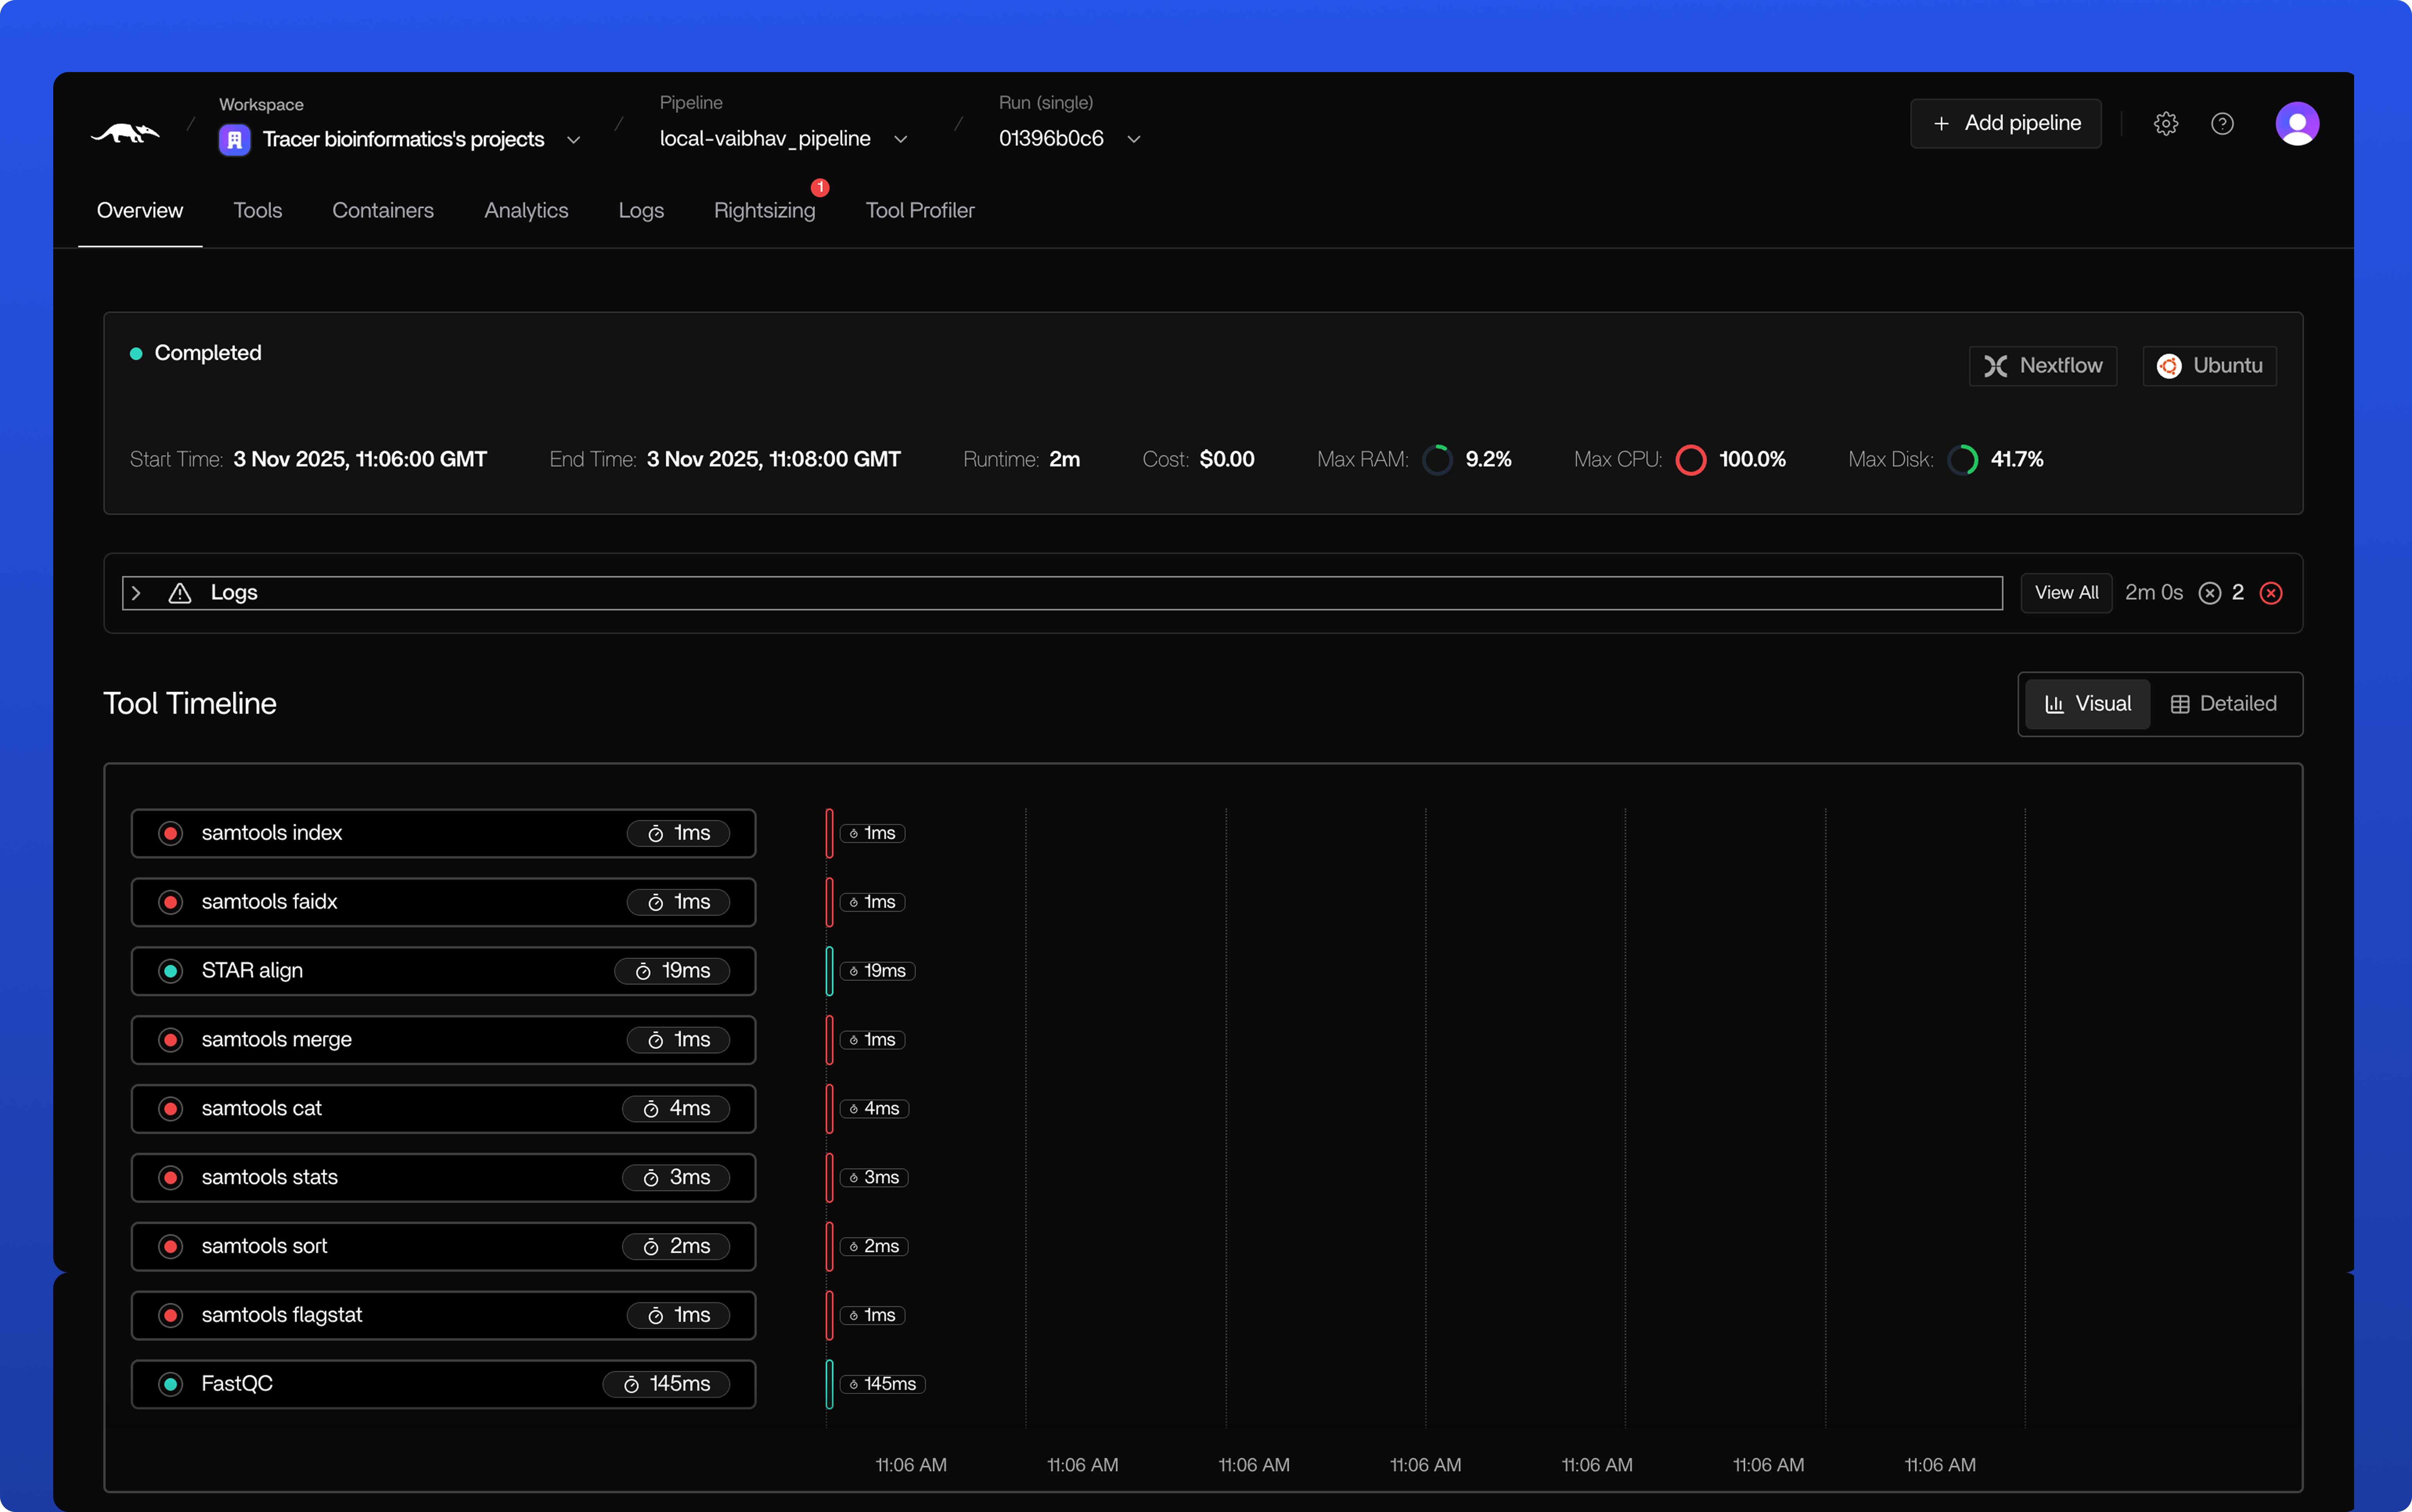
As you can see in the image above, multiple tasks failed and therefore need to be investigated.
Choose the Log to Investigate
Here, all logs of the failed run are shown. Select the log you want to investigate deeper.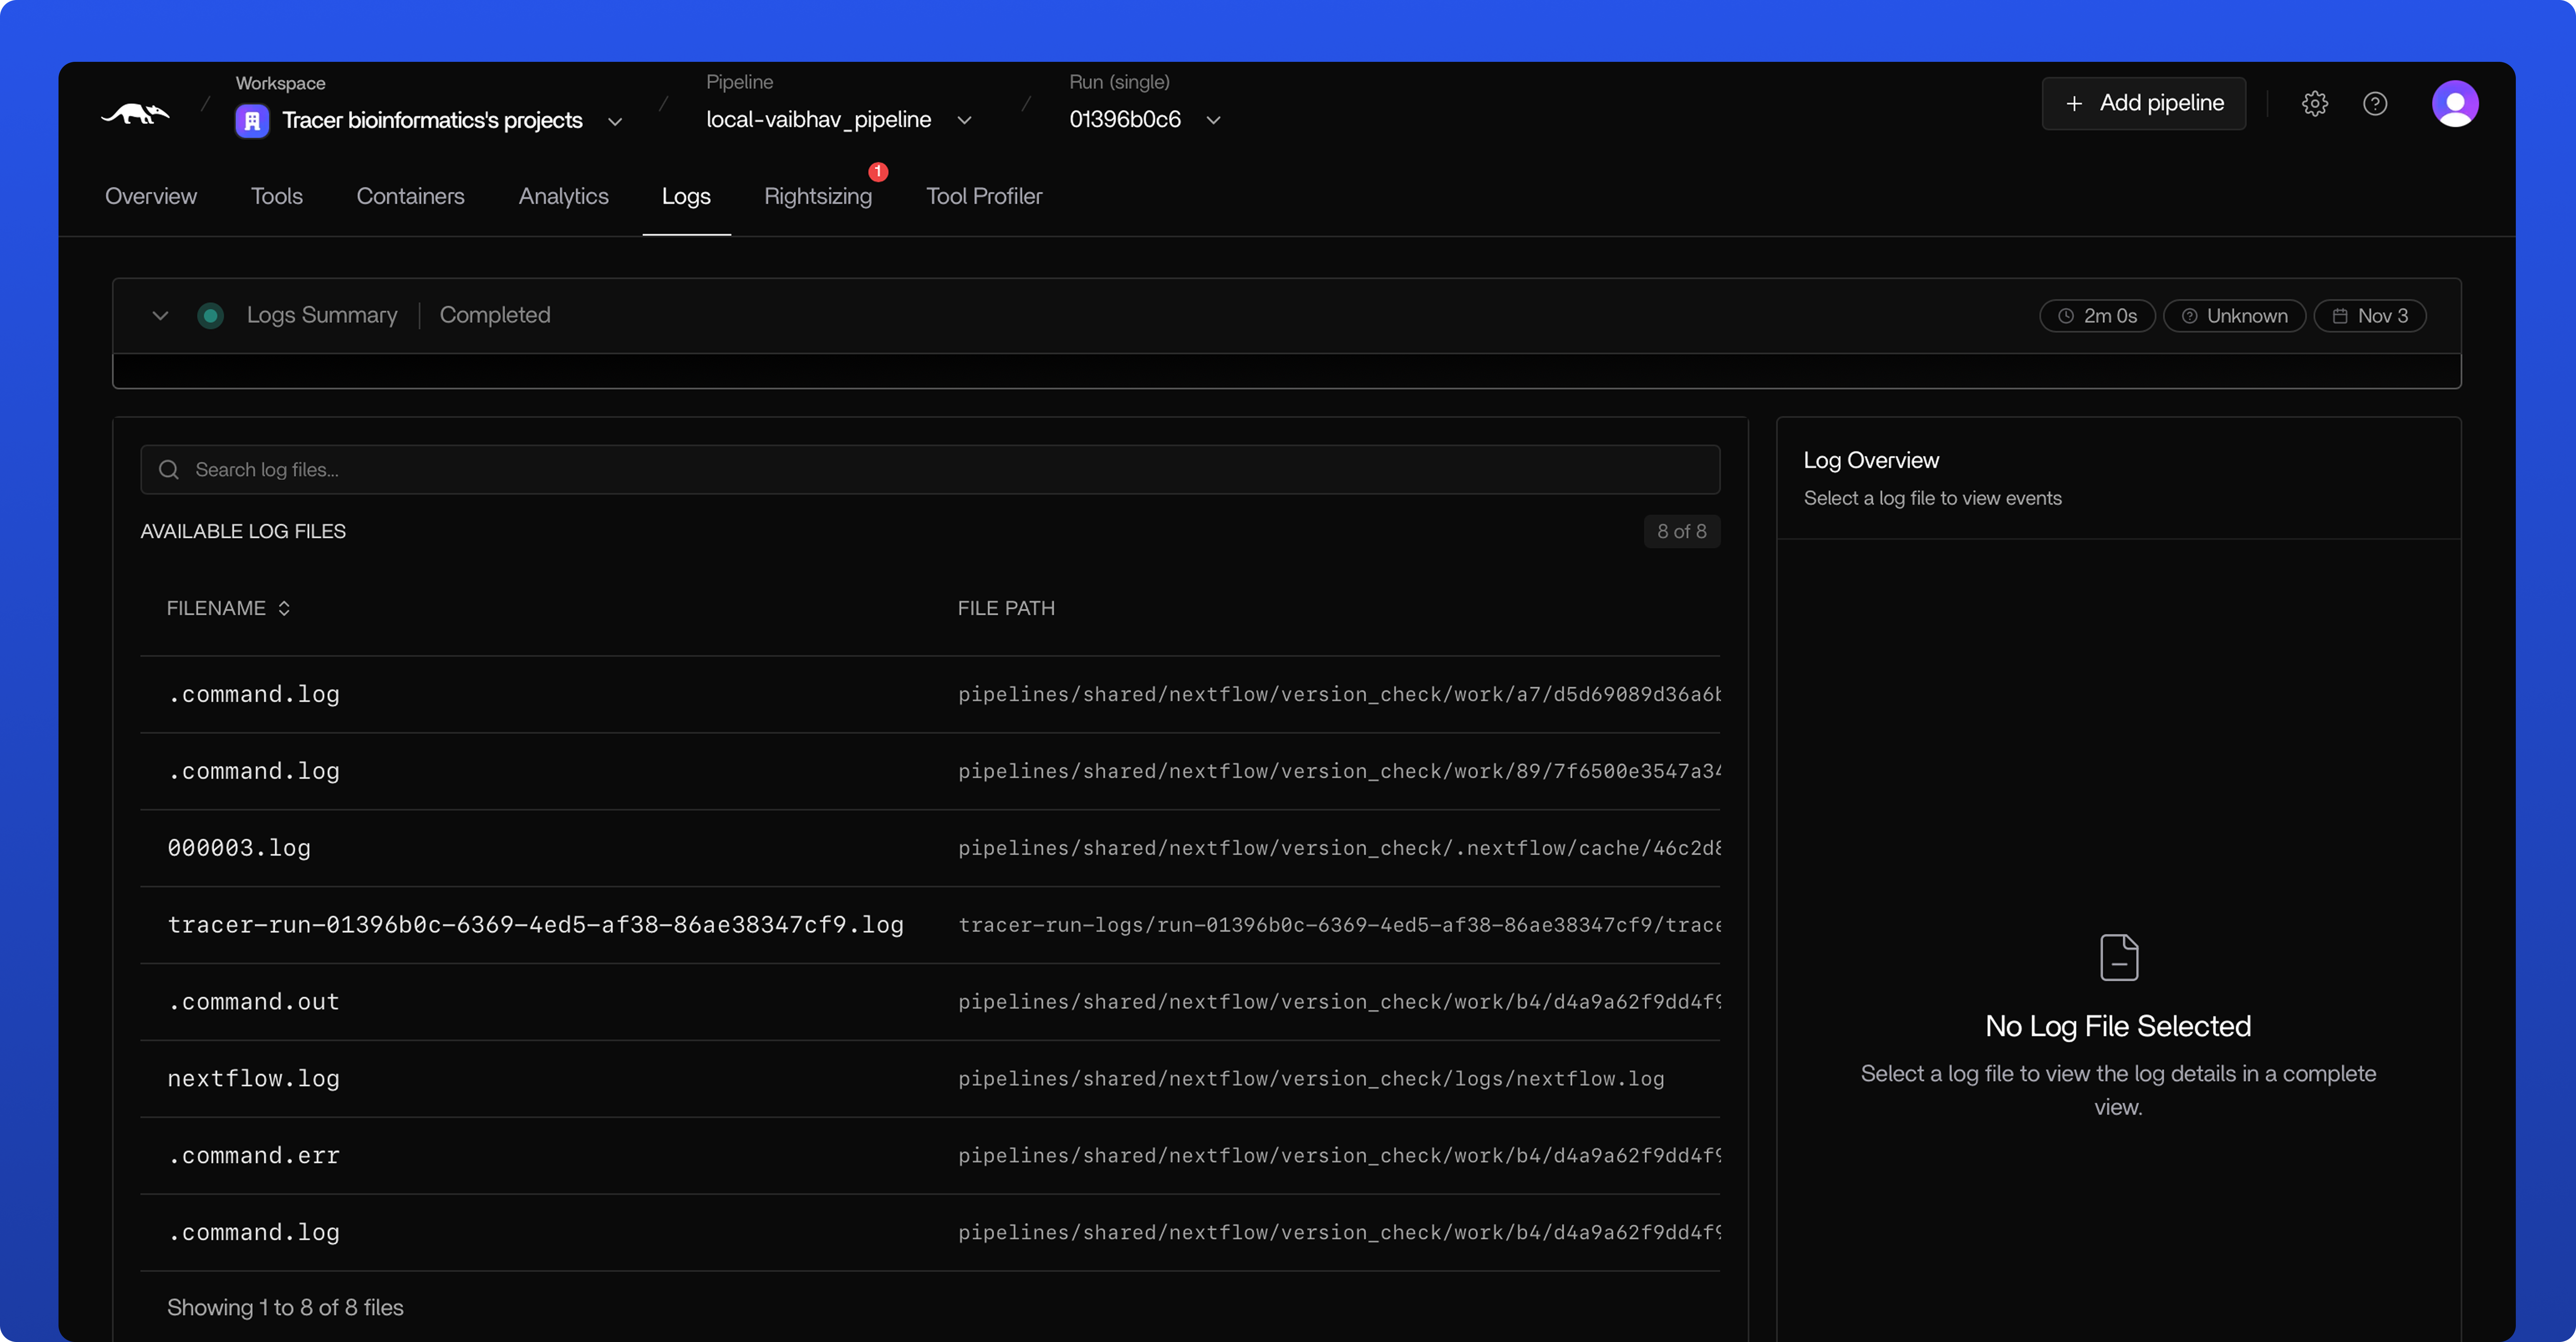
Logs & Insights
This page displays your log and its insights. It includes an error summary, plus automatic logs with warning and failure indicators.
Based on this data, our AI identifies likely root causes and tells you what happened, so you know exactly what needs attention. It also provides recommended solutions to resolve the issue.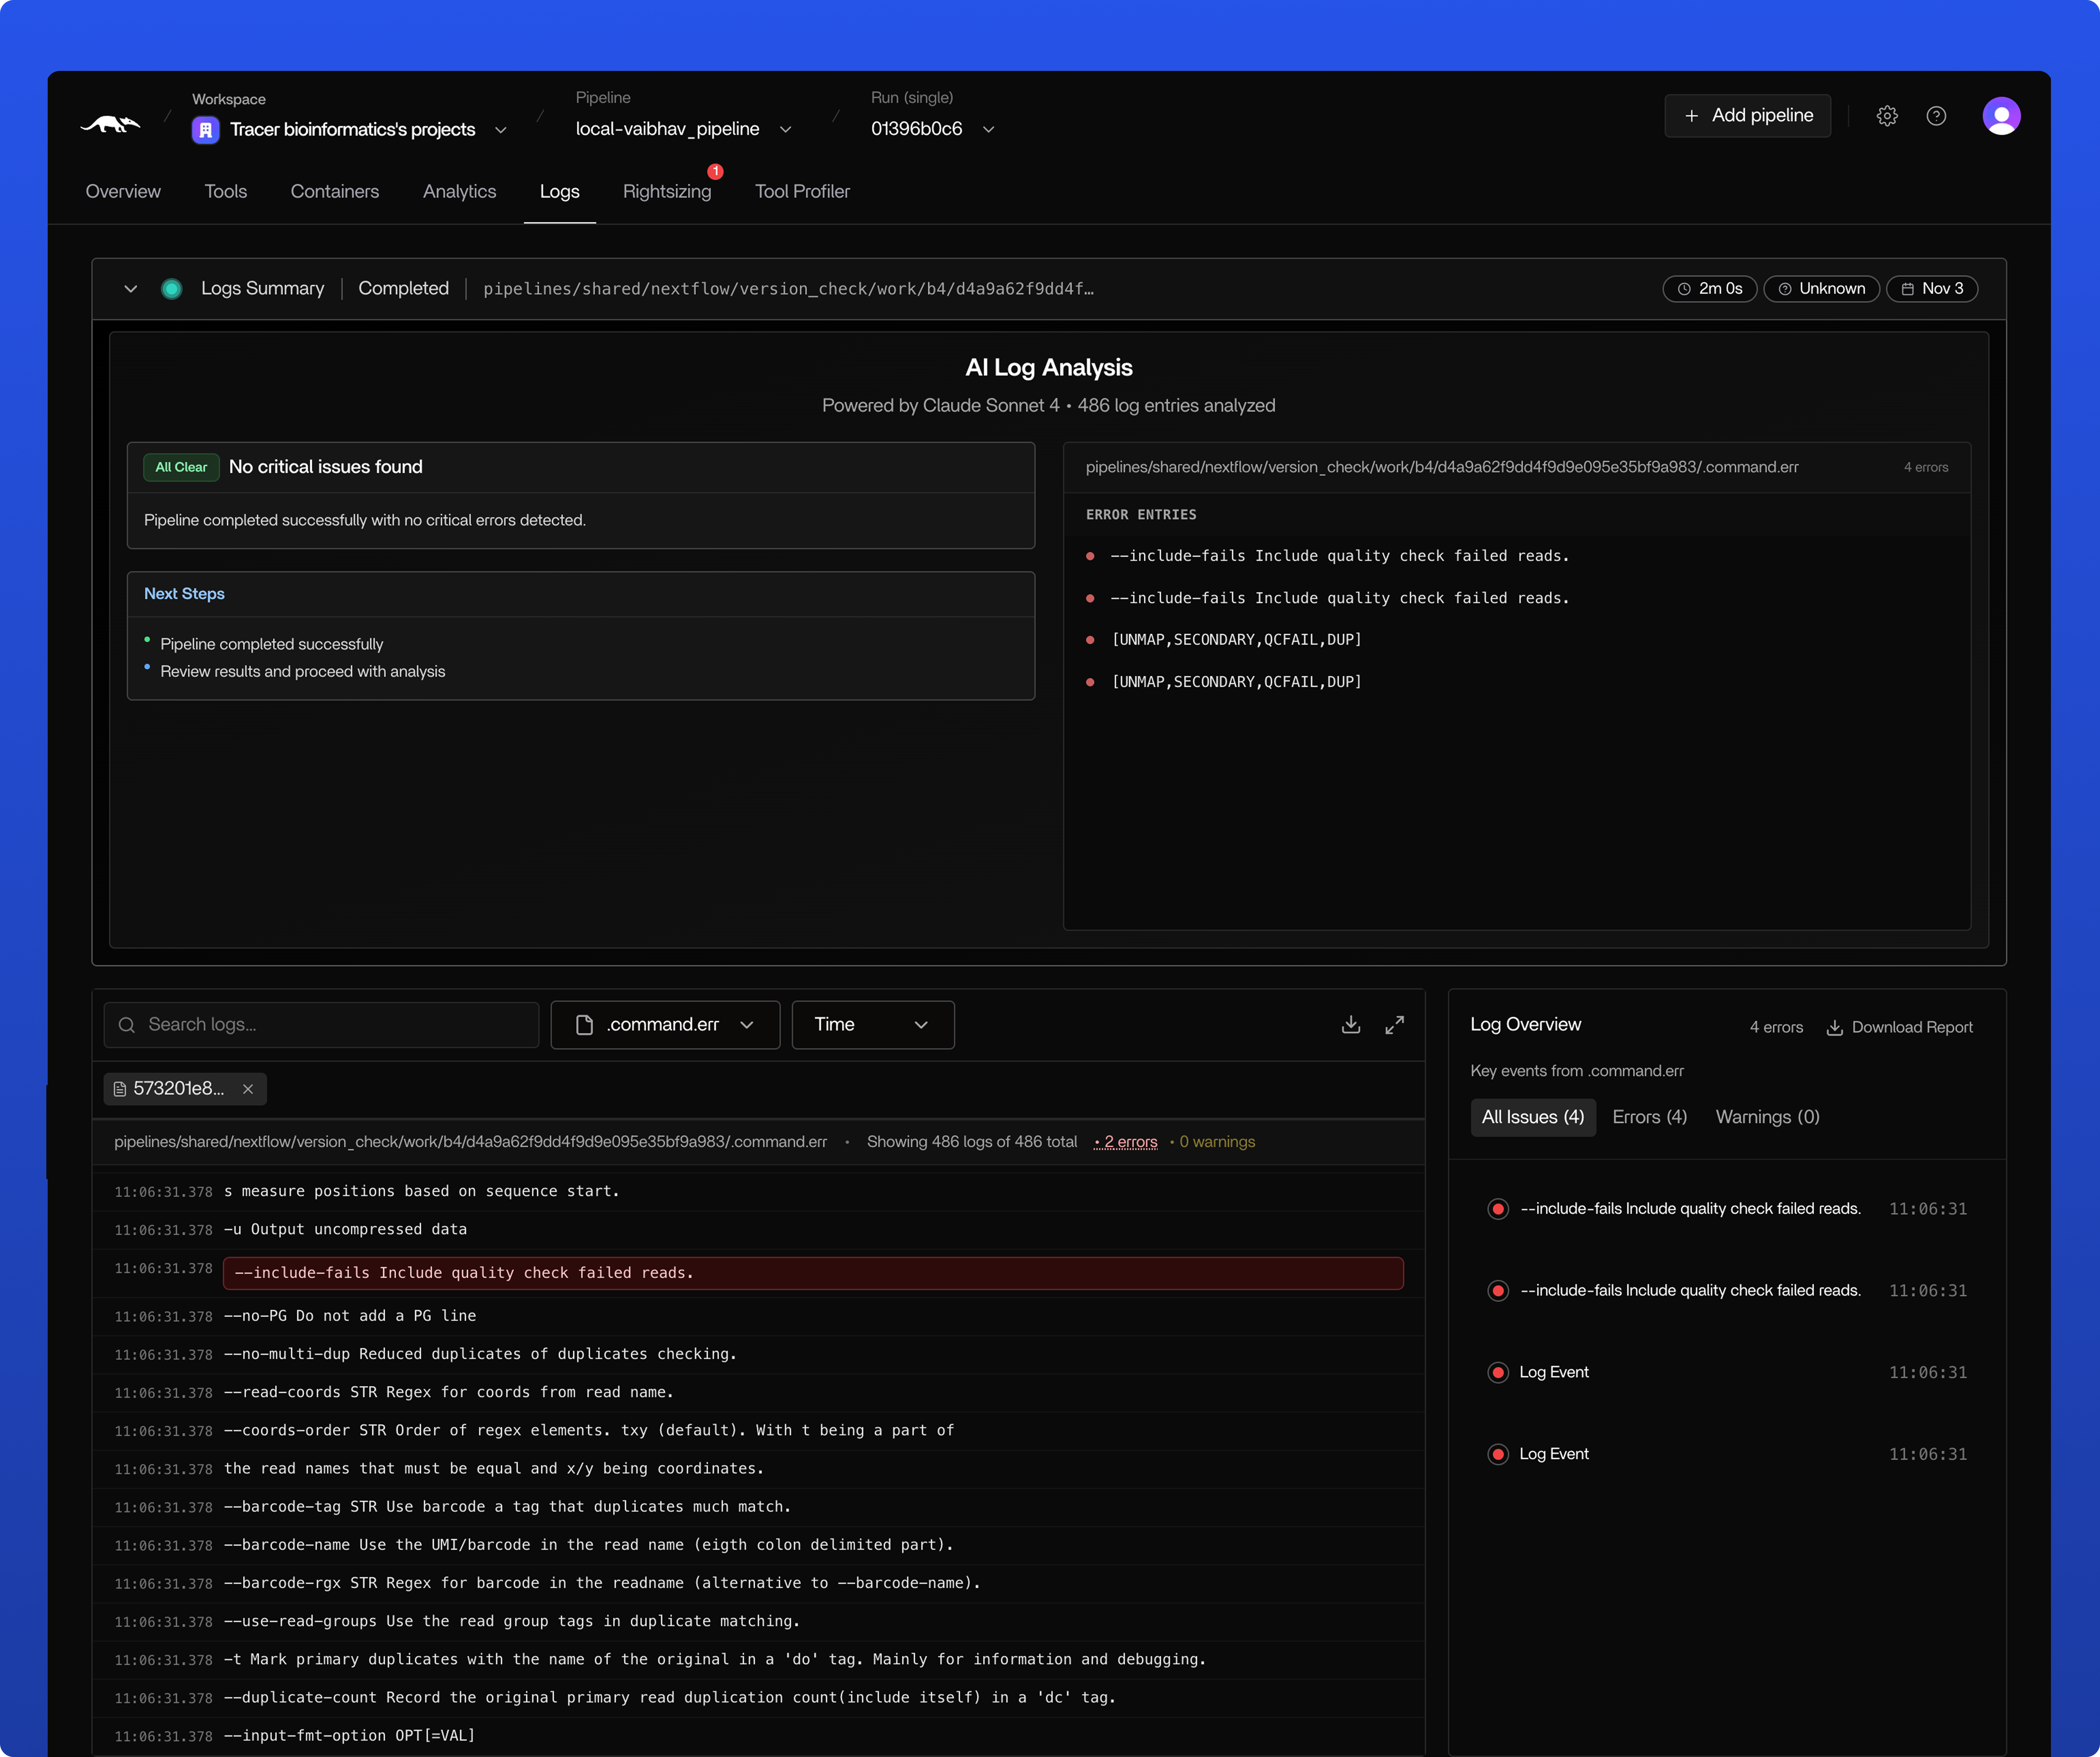
Based on this data, our AI identifies likely root causes and tells you what happened, so you know exactly what needs attention. It also provides recommended solutions to resolve the issue.
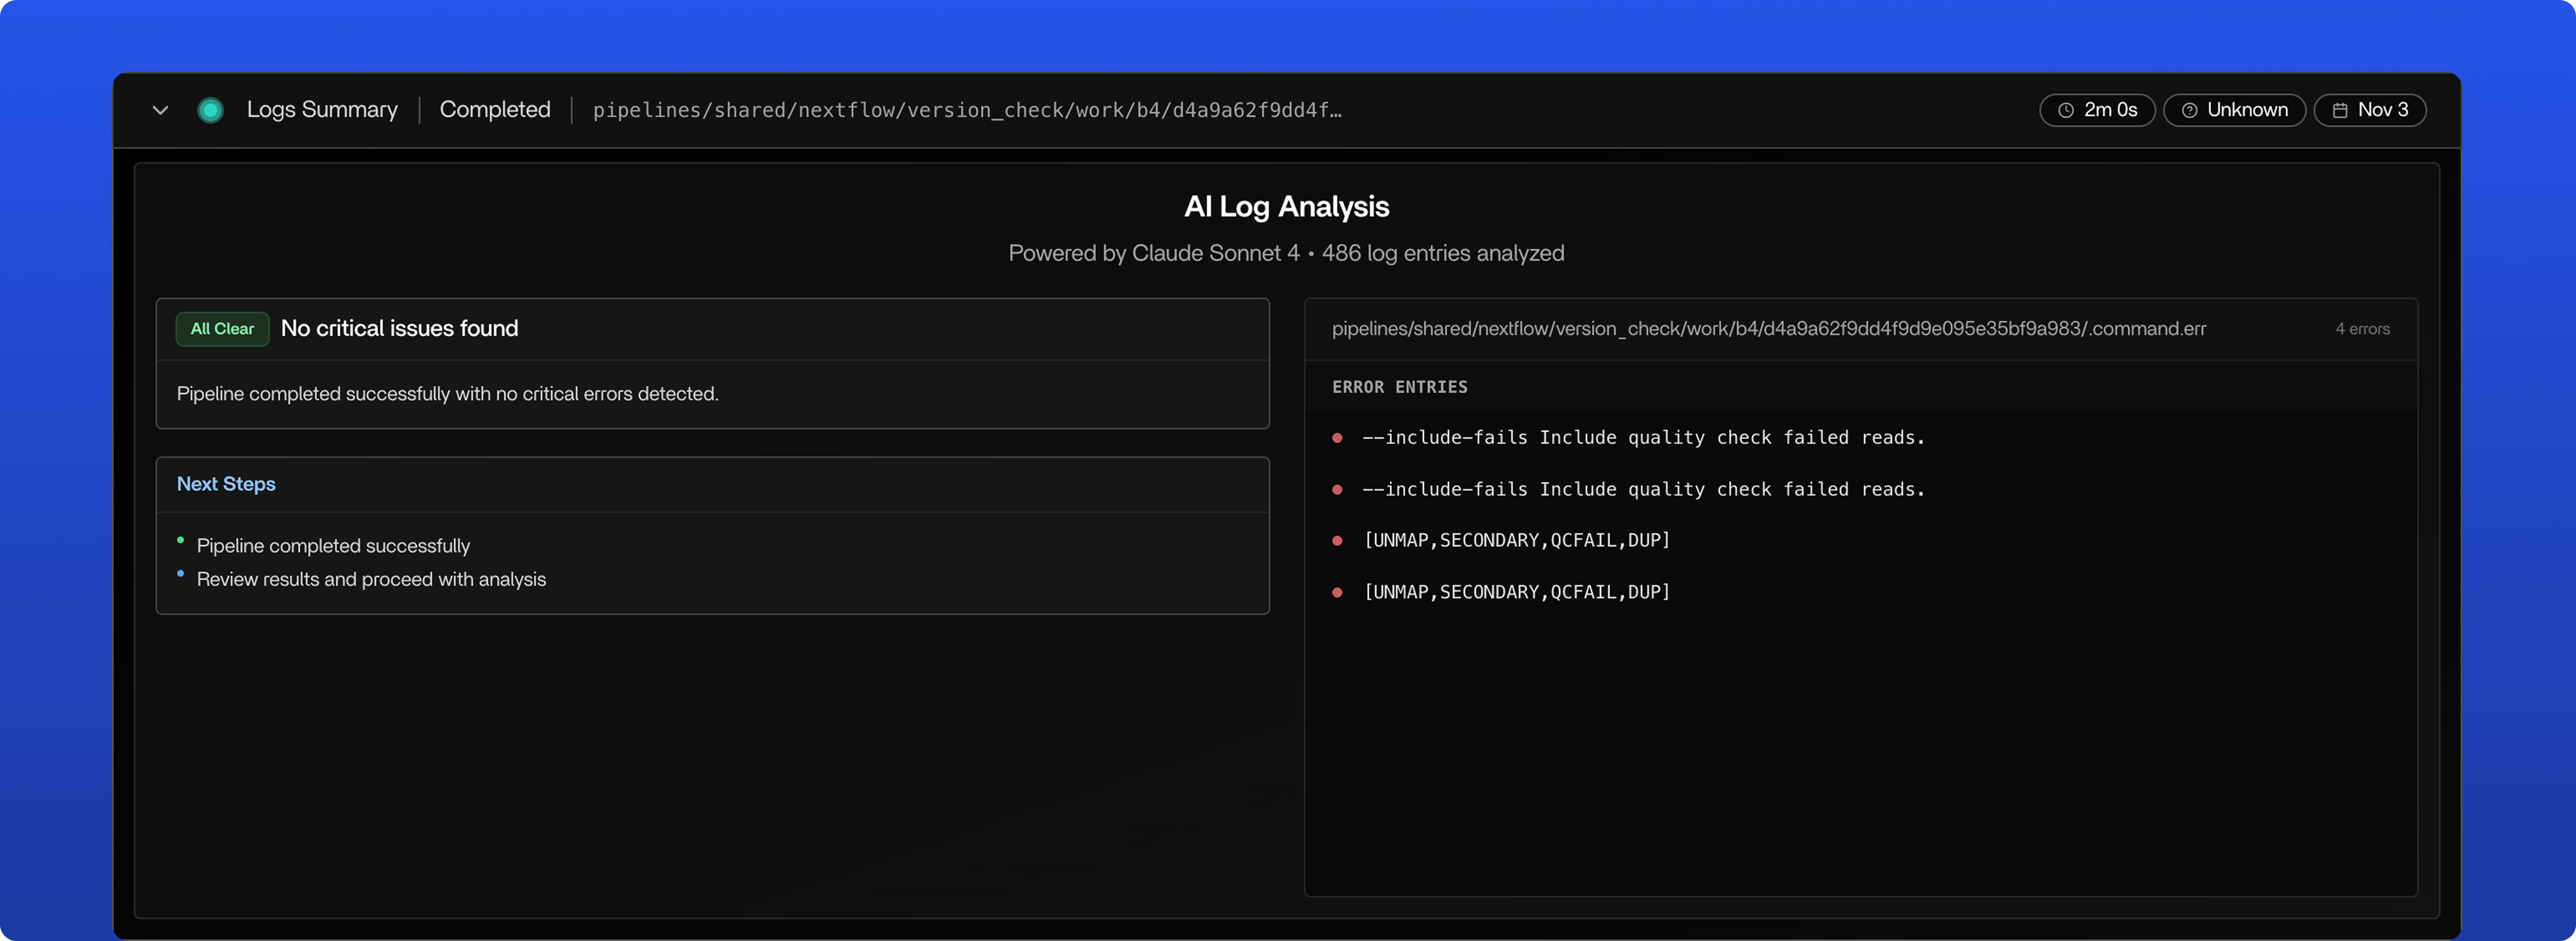
AI Log Analysis
Our AI Log Analysis is divide up into three main sections:
- Critical Issue Section - What exactly went wrong
- Next steps/Solution Suggestions - How to resolve the issue and refrain from making the same mistake again
-
Error Entries - The specific lines in the log that caused the error
Log Details
If you want to dig deeper into the logs, in this section you can see the full log with highlighted error lines.
On the right side, you can see the specific error entries that caused the task to fail together with the warning indicators. This also gives you the opportunity to download the full report.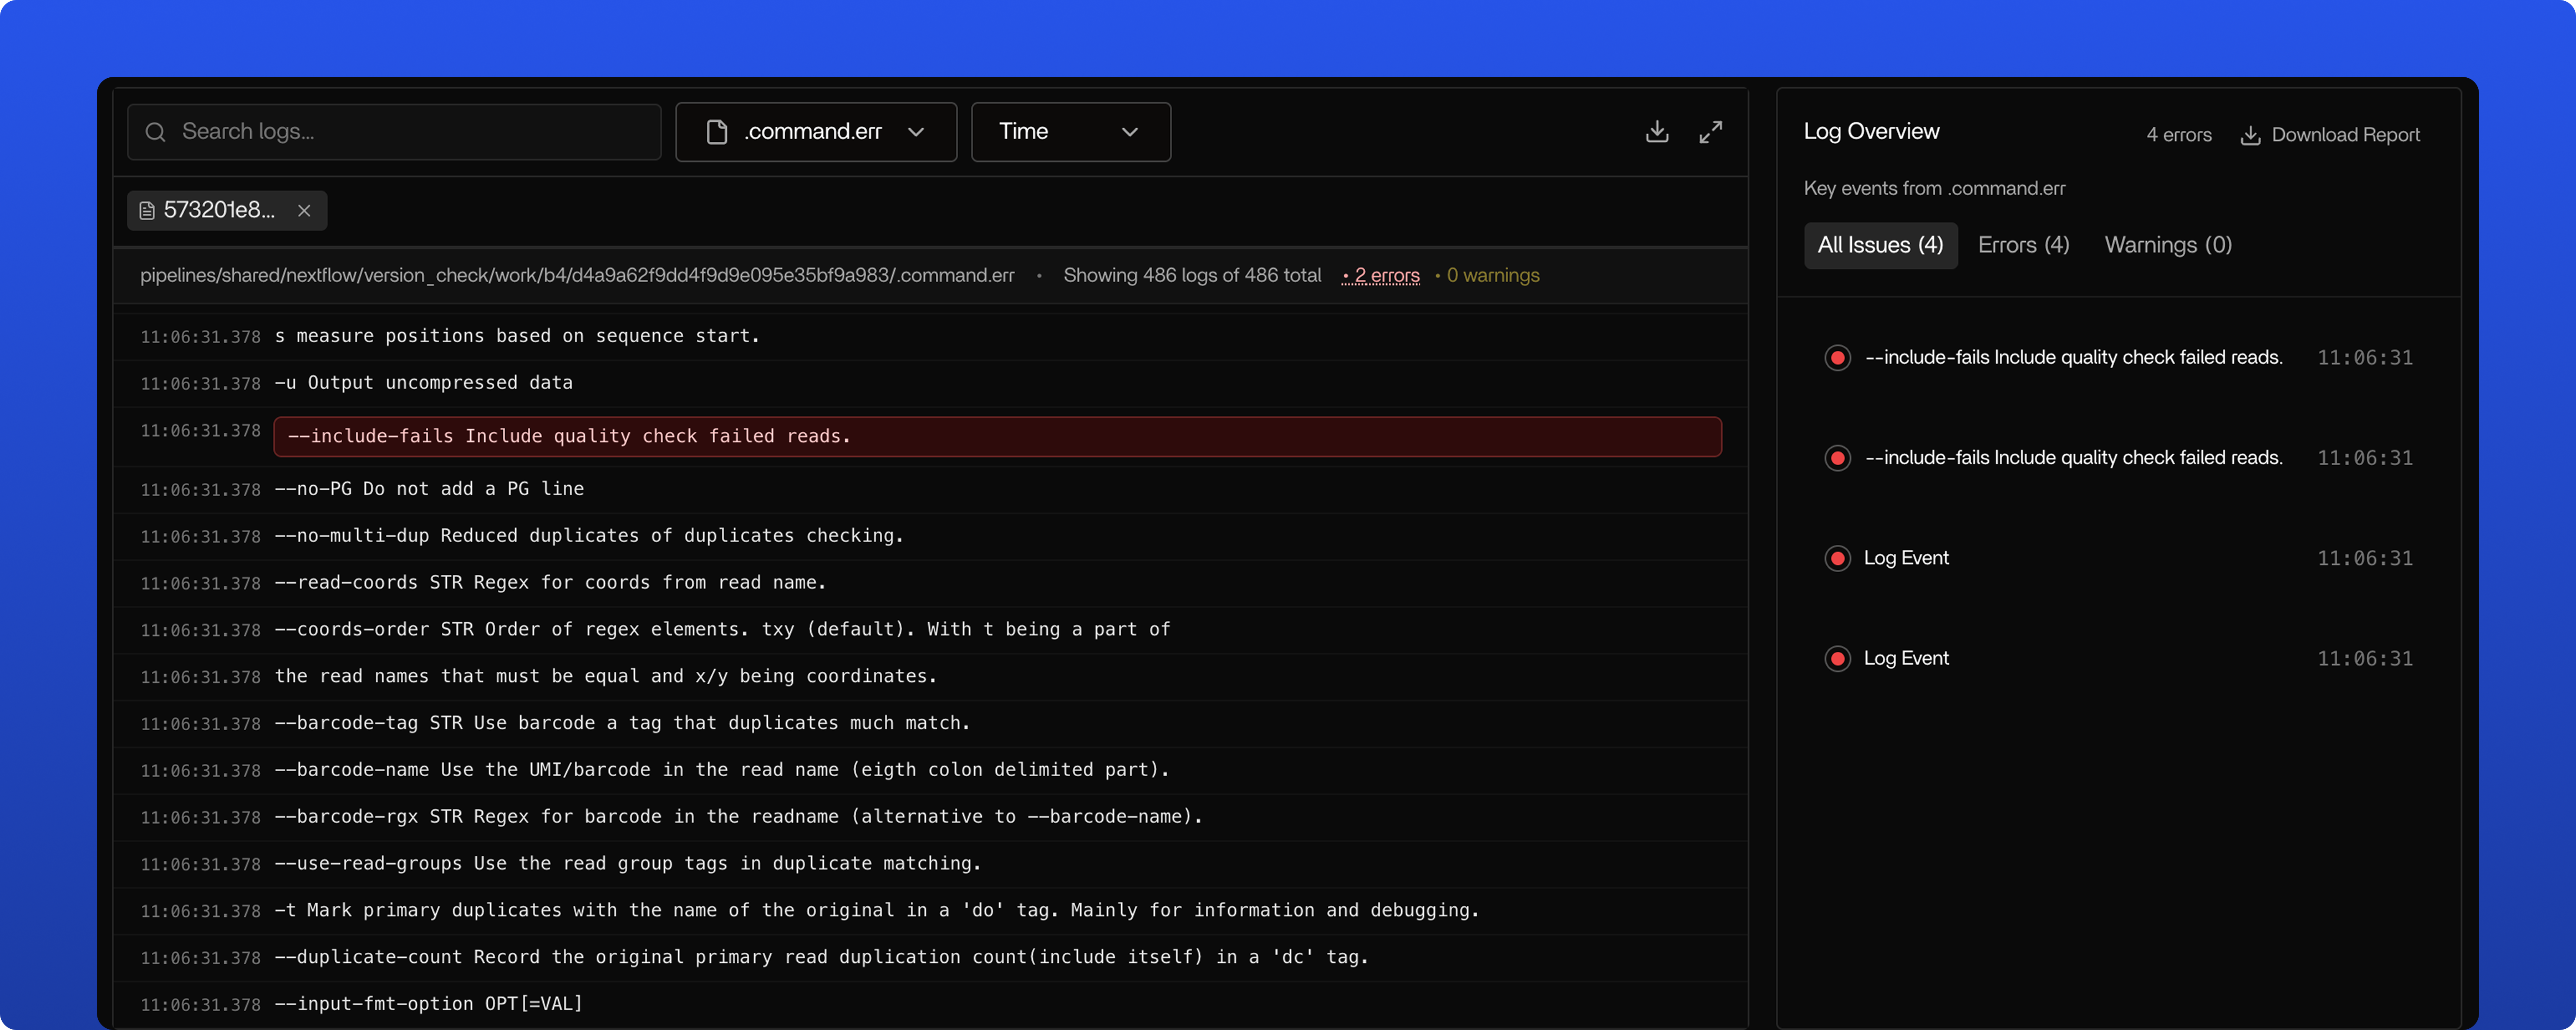
On the right side, you can see the specific error entries that caused the task to fail together with the warning indicators. This also gives you the opportunity to download the full report.
As logs can be very extensive, there are multiple ways of searching through the logs. You can use the search bar to search for specific keywords, or you can use the filter bar to filter for specific error types and you can filter on time as well.
Common Failure Patterns
Resource Exhaustion
Tasks may fail due to insufficient resources:- Out of Memory (OOM) - Task exceeded available RAM
- Disk Space - Insufficient storage for outputs
- CPU Timeout - Task exceeded maximum execution time
Tracer’s eBPF monitoring captures resource usage leading up to failures, helping you identify resource constraints.
Next Steps
Viewing Task Status
Learn how to monitor task execution