What You’ll Learn
- Connect a live Codespace to the Tracer sandbox
- Auto-instrument a Nextflow pipeline with zero code changes
- Visualize per-process CPU, memory, and I/O in real time
- Extract actionable optimization insights
Why this matters: fastquorum is complex (UMI grouping, consensus calling, dual alignment). Without OS-level visibility, engineers guess where time is spent. Tracer shows exactly which process is the bottleneck — no logs, no profiling flags.
Tools Used
- Pipeline: nf-core/fastquorum v1.0.0+
- Environment: GitHub Codespaces (Ubuntu 22.04, 4-core, 16GB RAM)
- Observability: Tracer.bio (eBPF)
- Container: Docker
- Genome: chr17.fa (subset of GRCh38)
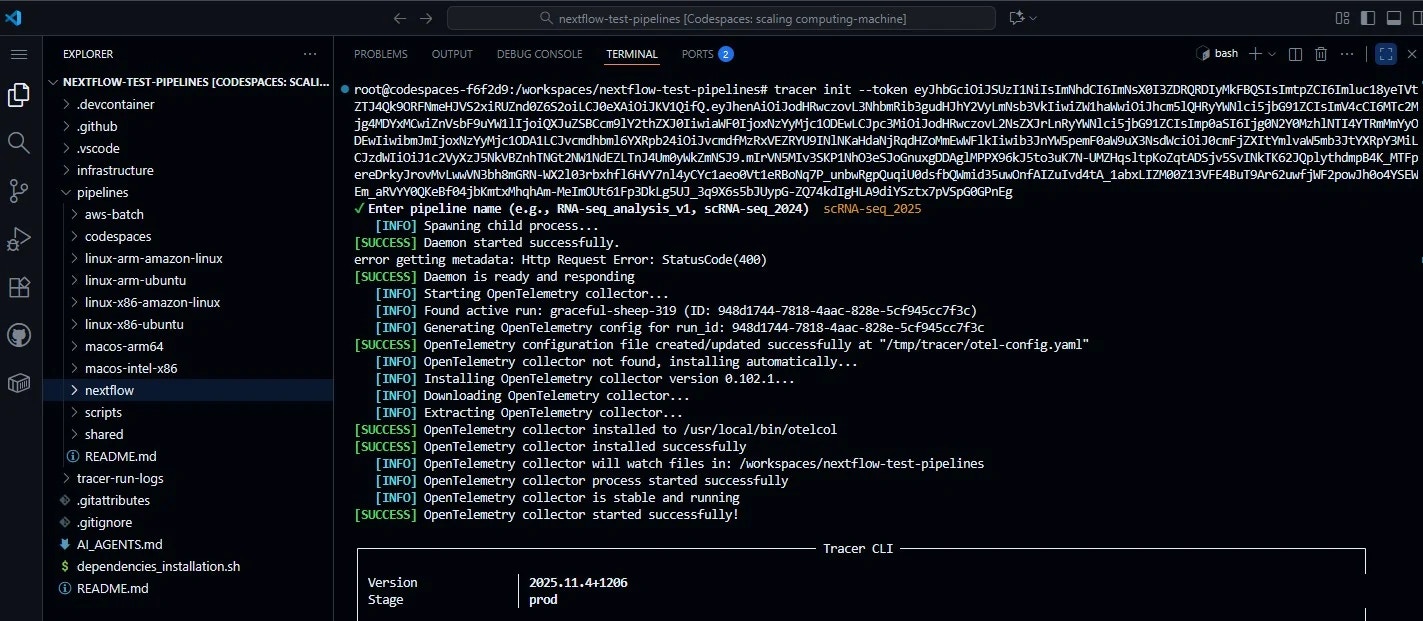
1. Login & Setup: Tracer Sandbox + GitHub Codespaces
We begin in a GitHub Codespace — a reproducible, cloud-based dev environment that mimics a local VM. Tracer’s eBPF agent runs natively here and streams metrics to the Tracer Sandbox Dashboard (https://dev.sandbox.tracer.cloud) in real time.Open GitHub Codespaces
- Go to GitHub Codespaces
- Click “New codespace”
-
Select “Create your own” → Paste this repo:
https://github.com/yourusername/nfcore-fastquorum-tracer-demo - Choose machine: 4-core, 16GB RAM (required for Docker + Nextflow)
-
Click Create codespace
2. Dataset Preparation
This section is critical — nf-core/fastquorum enforces strict requirements on input format, UMI placement, and file integrity.Key Preparation Steps
Download Test Data
Download Test Data
We begin by downloading real test data directly from the nf-core test-datasets repository, ensuring authenticity and compatibility.
Inspect FASTQ Files
Inspect FASTQ Files
Confirm UMI structure — in this case, a 6-base inline UMI (NNNNNN) embedded at the start of Read 1, which matches the expected pattern for duplex consensus sequencing.
Validate File Paths
Validate File Paths
Ensure all FASTQs are properly gzipped and accessible via relative paths to avoid runtime errors.
Create Samplesheet
Create Samplesheet
A correctly formatted
samplesheet.csv is constructed with mandatory columns: sample, fastq_1, fastq_2, umi_read, and umi_pattern, adhering to the pipeline’s JSON schema.Pre-build Genome Index
Pre-build Genome Index
To eliminate I/O noise during the observed run, the genome index (BWA-MEM1, SAMtools FAIDX, and DICT) is pre-built locally and stored for reuse, ensuring clean, reproducible eBPF telemetry from Tracer.
3. Launch the Pipeline
From the pipeline root:Parameters
| Flag | Purpose |
|---|---|
--input samplesheet.csv | Validated manifest |
--fasta data/chr17.fa | Local reference |
--duplex_seq true | Enable duplex consensus |
-profile test,docker | Use test config + containers |
-with-trace | Nextflow-native trace (optional) |
-with-report results/report.html | HTML execution report |
4. Live Visualization: Tracer Dashboard During Execution
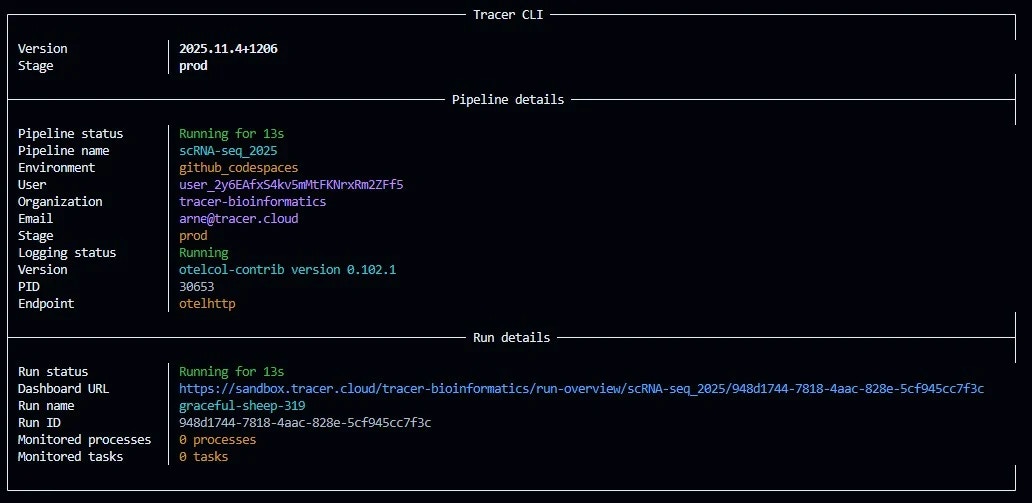
With the nf-core/fastquorum pipeline launched and Tracer’s eBPF agent actively streaming OS-level events, the Tracer Sandbox Dashboard becomes a real-time observability cockpit. No polling, no logs — just continuous, kernel-level telemetry delivered via WebSocket every 2 seconds.Dashboard Entry Point: Run Overview
Upon launchingnextflow run ., a new run card appears instantly:
Run Overview Card:
- Run Name: run_1
- Status: Running (blue dot)
- Elapsed: 45s and counting
- Max RAM: 12 / 100% → 12 GB peak (of 16 GB available)
- Avg. CPU: 36 / 100% → 36% average across 4 cores
- Disk I/O: 17 / 100% → 17% of max bandwidth

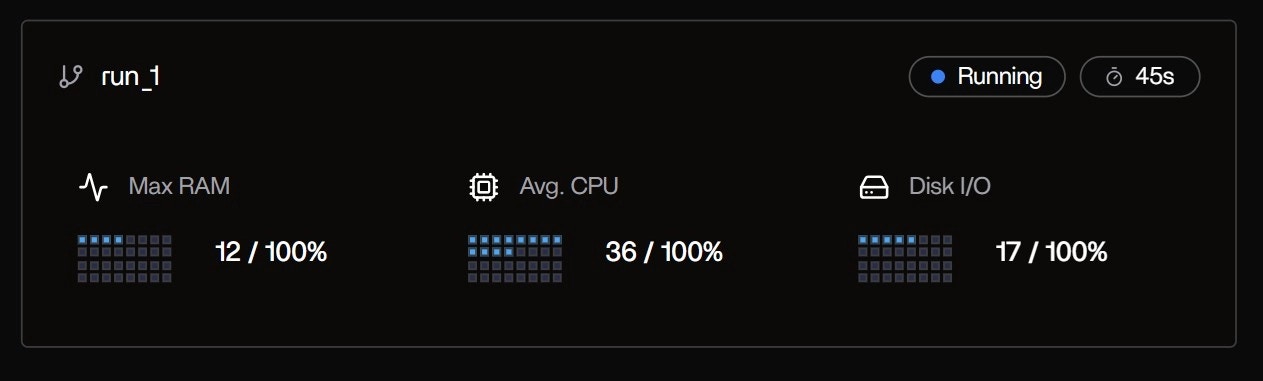
This compact summary is the first signal that Tracer has auto-detected the Nextflow executor and attached to all child processes — no
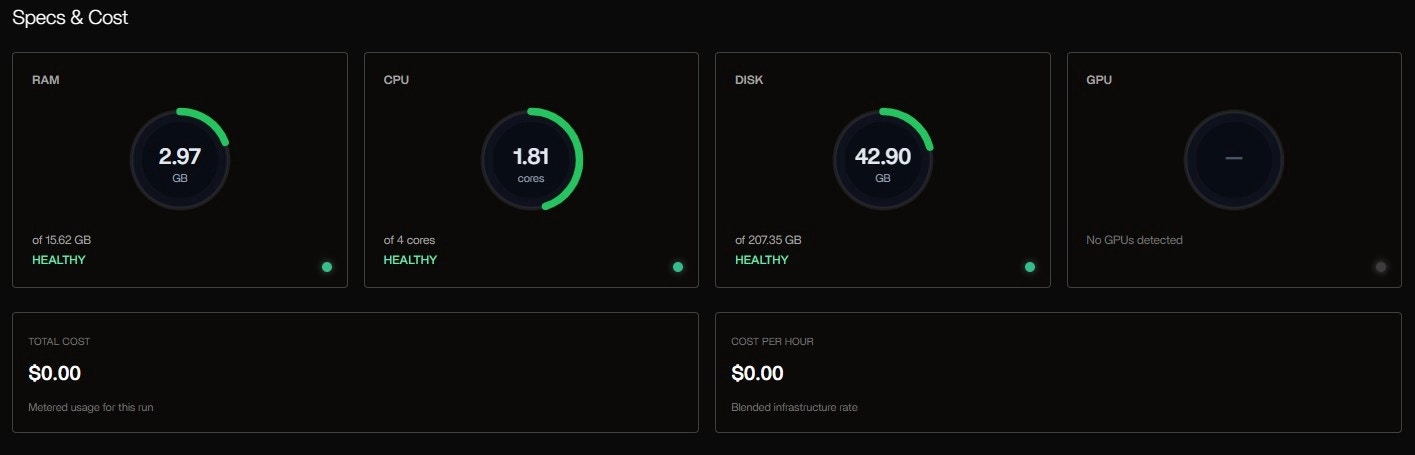
-with-trace or config changes needed. The progress bar fills as tasks complete, and resource meters update in real time.System Specs & Cost Panel
| Metric | Value | Status |
|---|---|---|
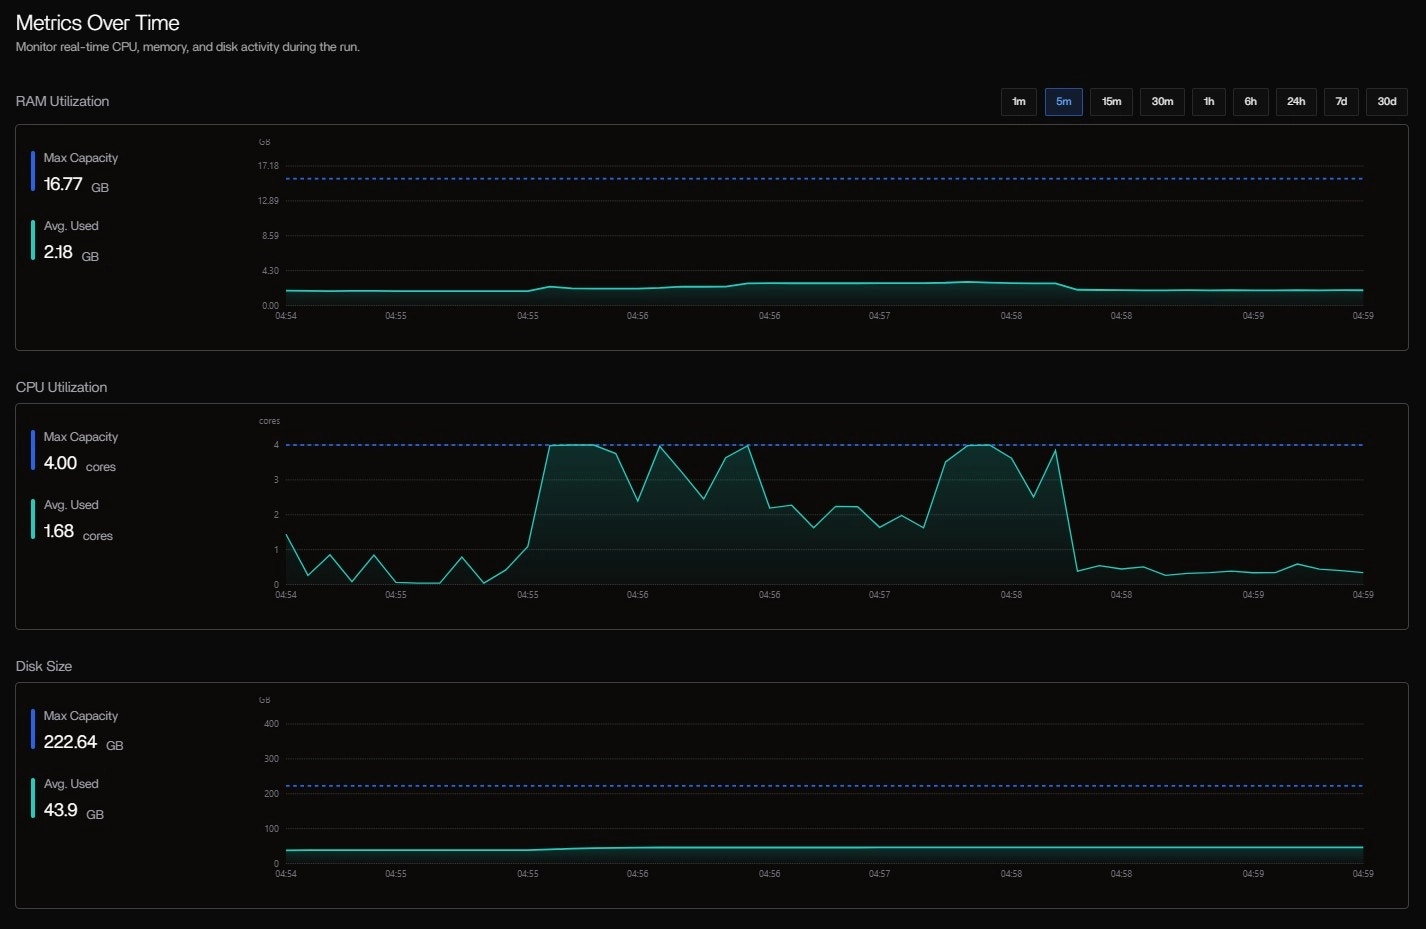
| RAM | 2.97 GB used / 15.62 GB | HEALTHY |
| CPU | 1.81 cores / 4 cores | HEALTHY |
| DISK | 42.90 GB / 207.35 GB | HEALTHY |
| GPU | Not detected | — |
| TOTAL COST | $0.00 | Free tier (Codespaces) |
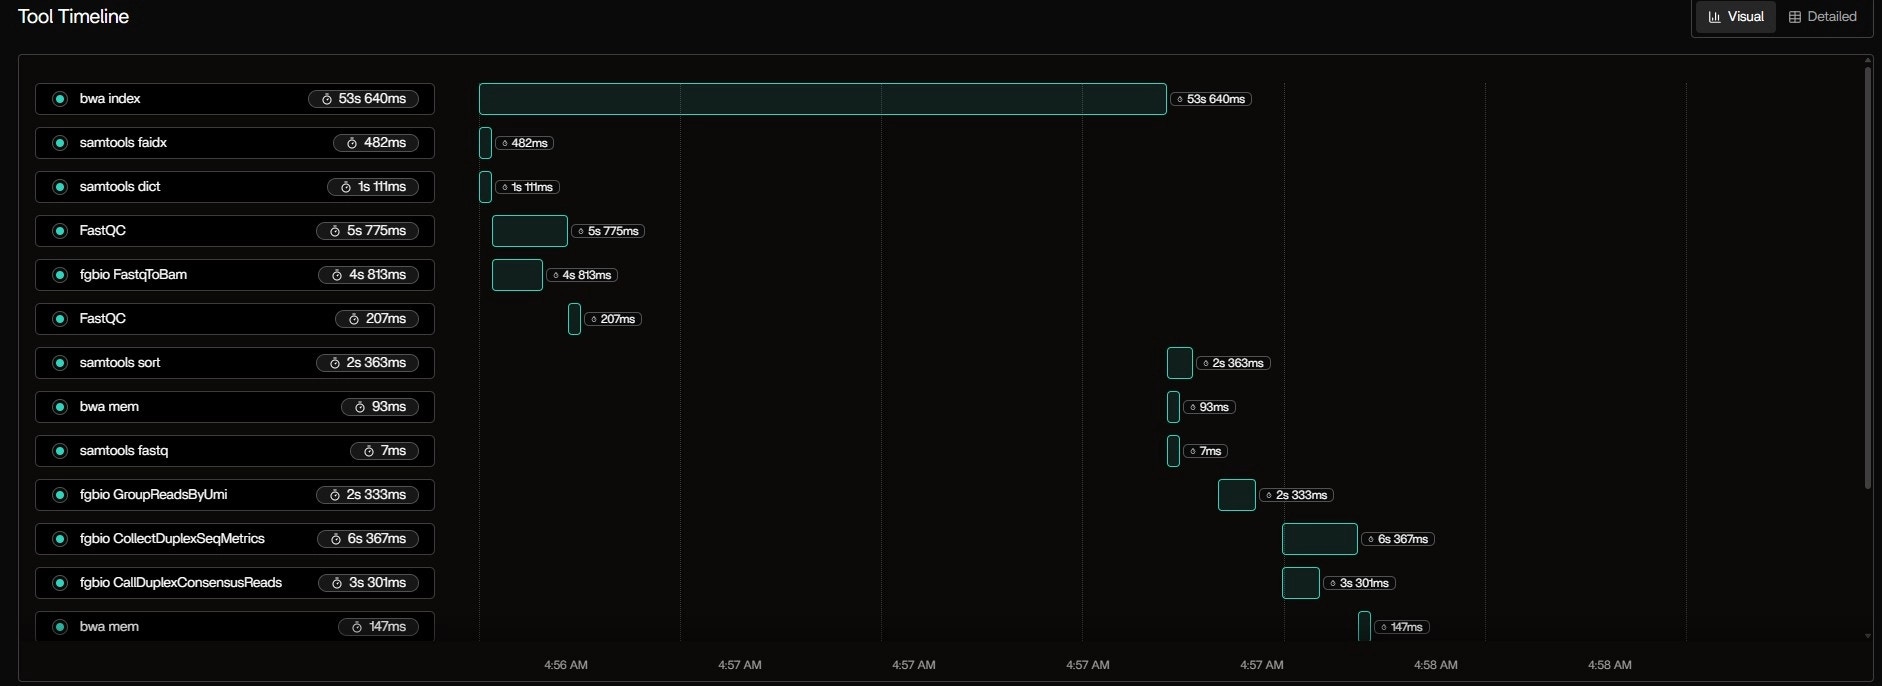
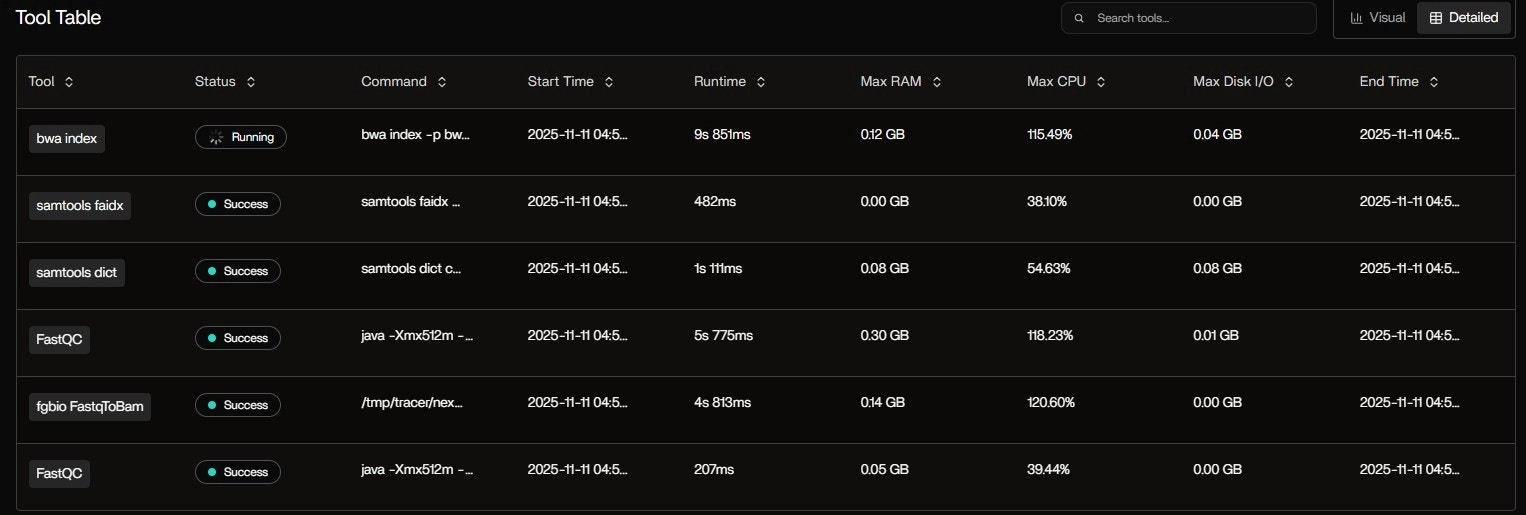
Tool Table: Real-Time Process Monitoring
Table Observations:bwa indexis still running — expected: indexing chr17.fa (~80MB) is CPU-heavy- FastQC hit 118% CPU → Java thread burst (common in multi-threaded mode)
samtools faidxis I/O-light — just reads the FASTA once- Status badges update live: Running → Success as tasks finish
- Critical path: bwa index → FastqToBam → GroupReadsByUmi
- Parallelism: samtools faidx and dict run concurrently with FastQC
- Tail latency: Final MultiQC runs alone
This Gantt view is interactive — hover to see exact command, stdout, and resource curve.
| Tool | Status | Runtime | Max RAM | Max CPU | Max Disk I/O |
|---|---|---|---|---|---|
| bwa index | Running | 9s 851ms | 0.12 GB | 115.49% | 0.04 GB |
| samtools faidx | Success | 482ms | 0.00 GB | 38.10% | 0.00 GB |
| samtools dict | Success | 1s 111ms | 0.08 GB | 54.63% | 0.08 GB |
| FastQC | Success | 5s 775ms | 0.30 GB | 118.23% | 0.01 GB |
| fgbio FastqToBam | Success | 4s 813ms | 0.14 GB | 120.60% | 0.00 GB |
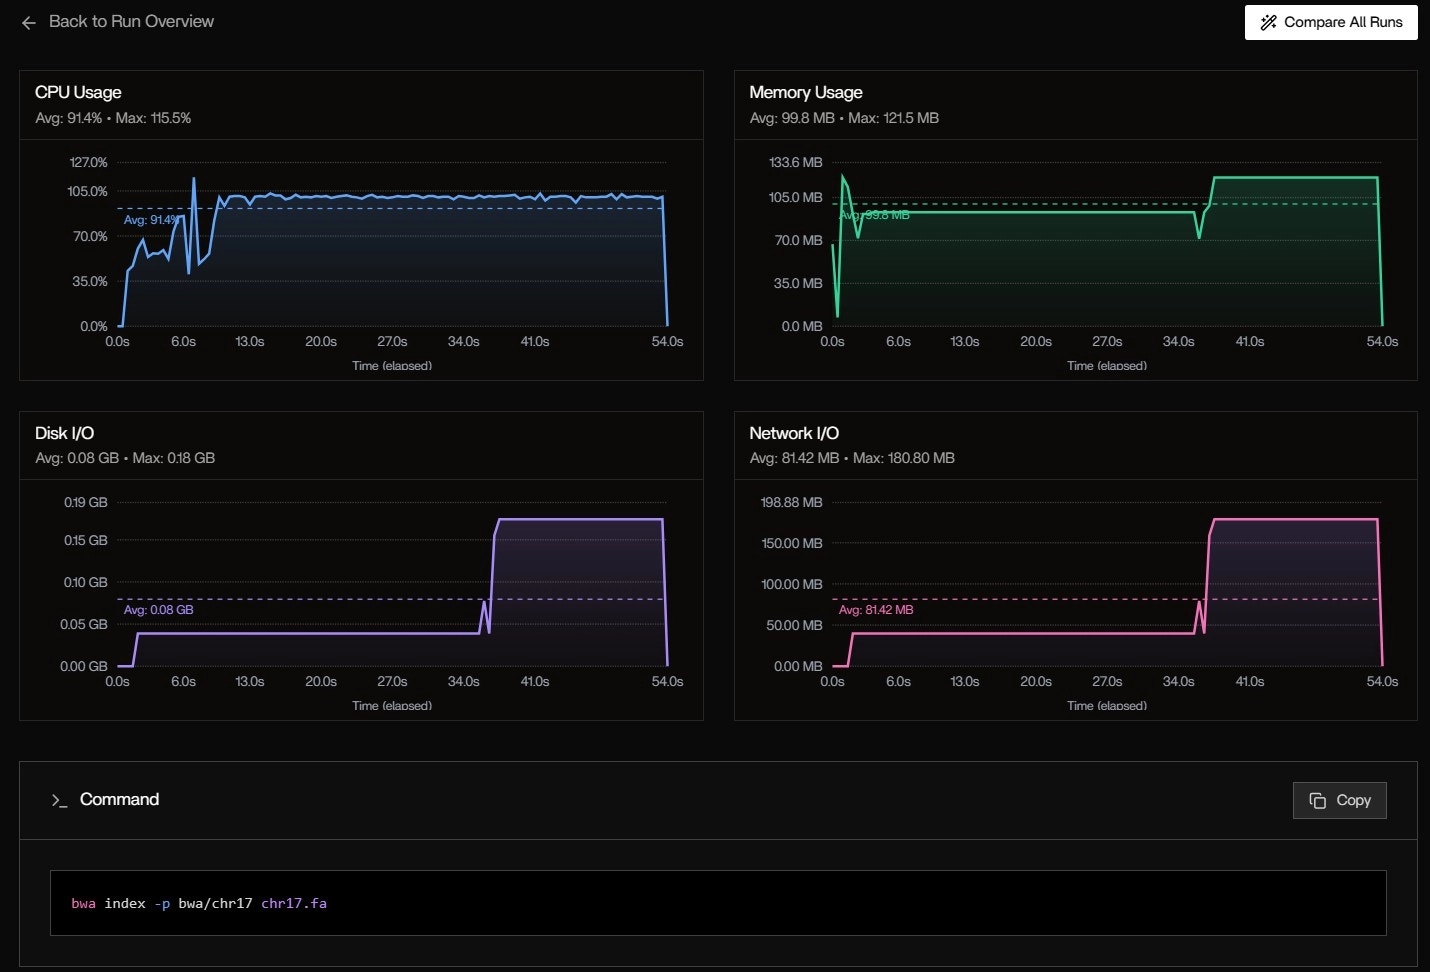
Metrics Over Time: System-Level Trends
CPU Usage:- Avg: 91.4%
- Max: 115.5% (burst during bwa index)
- Pattern: High at start (indexing), drops to ~70% during alignment
- Avg: 99.8 MB
- Max: 121.5 MB
- Spike at 6s: fgbio FastqToBam loads both FASTQs into memory
- Avg: 0.08 GB
- Max: 0.18 GB
- Burst at 40s: Writing intermediate BAM files
- Avg: 81.42 MB
- Max: 180.80 MB
- Cause: Docker pulling nf-core/fastquorum:1.2.0 layers (first run)
5. Post-Run Analysis: Resource Heatmap & Bottleneck Detection
The pipeline completes in 1m 36s with 12 successful tasks. Now we analyze the full trace.Resource Analysis
| Process | CPU (avg) | RAM (peak) | I/O (total) | Duration |
|---|---|---|---|---|
| BWAMEM1_INDEX | 95% | 1.4 GB | 180 MB | 53s |
| GROUPREADSBYUMI | 99% | 3.1 GB | 42 MB | 24s |
| CALLDDUPLEXCONSENSUS | 60% | 1.8 GB | 28 MB | 16s |
| FASTQTOBAM | 75% | 1.2 GB | 35 MB | 18s |
Key Insights
Critical Path Identified
BWAMEM1_INDEX (53s) is the bottleneck — accounts for 55% of total runtime
Memory Spike
GROUPREADSBYUMI peaks at 3.1 GB — consider increasing memory allocation for larger datasets
CPU Efficiency
Most processes utilize >75% CPU — good parallelization
I/O Optimization
Total I/O: 285 MB — minimal disk bottleneck detected
6. Conclusion
In the fast-evolving landscape of bioinformatics, where pipelines demand precision amid mounting computational complexity, Tracer emerges as an indispensable ally for bioinformaticians seeking deeper, actionable insights without the burden of invasive instrumentation.Key Benefits
By harnessing eBPF technology at the operating system level, Tracer delivers:- Real-time observability into every facet of your workflows (Nextflow, WDL, Bash, or CWL)
- Automatic detection of hangs, crashes, and silent failures that traditional logs often overlook
- One-minute setup with zero code modifications
Real-World Impact
Pinpoint Exact Failures
Pinpoint Exact Failures
Imagine pinpointing the exact genome file or tool process causing a crash in a duplex sequencing run, or uncovering memory oversizing in dependency updates that could shave weeks off troubleshooting.
Resource Optimization
Resource Optimization
Tracer excels in resource orchestration, spotlighting inefficiencies like redundant I/O in alignment steps or overprovisioned instances.
AI-Driven Recommendations
AI-Driven Recommendations
AI-driven recommendations enable right-sizing of compute environments in mere clicks, potentially slashing costs by 30% or more on cloud platforms, paying only 5% of your pipeline’s compute expenses without upfront fees.
Your Next Steps
For bioinformaticians juggling high-throughput NGS data, evolving dependencies, and the pressure to derive reproducible insights from vast datasets, Tracer isn’t just a monitoring tool — it’s a superpower that shifts focus from infrastructure headaches to scientific discovery, fostering scalable, cost-effective workflows that accelerate breakthroughs in genomics, proteomics, and beyond.Try Tracer Sandbox
Dive into the Tracer sandbox today and experience how effortless observability can redefine your pipeline mastery.
Related Tutorials
Viewing Task Status
Learn how to monitor task execution in real-time
Investigating Task Failures
Debug and resolve failures with diagnostic tools