Data Lake
Query all your pipeline runs to analyze sample processing turnaround times, costs per pipeline execution, error correlations and performance trends across projects.How It Works
We ingest all your pipeline telemetry, metrics, and logs into a multi-tenant data lake. You can then use the Tracer web interface to query this data to analyze performance, identify bottlenecks, and optimize your pipelines. Identify underperforming steps, track which projects need attention, and monitor how efficiency changes over time. Tracer allows you to export all pipeline telemetry, metrics, and logs to your data lake for custom analysis and long-term retention. You can calculate cost per sample, measure run durations, and compare throughput across pipelines to identify optimization opportunities. Tracer also makes it easier to spot regressions, monitor efficiency trends, and inspect error types so teams can locate bottlenecks, prioritize fixes, and improve their workflows using real execution data.Key Analytics
Pipeline Success Rate Analysis
Track overall pipeline health with metrics such as success rate, total executions, and average turnaround times.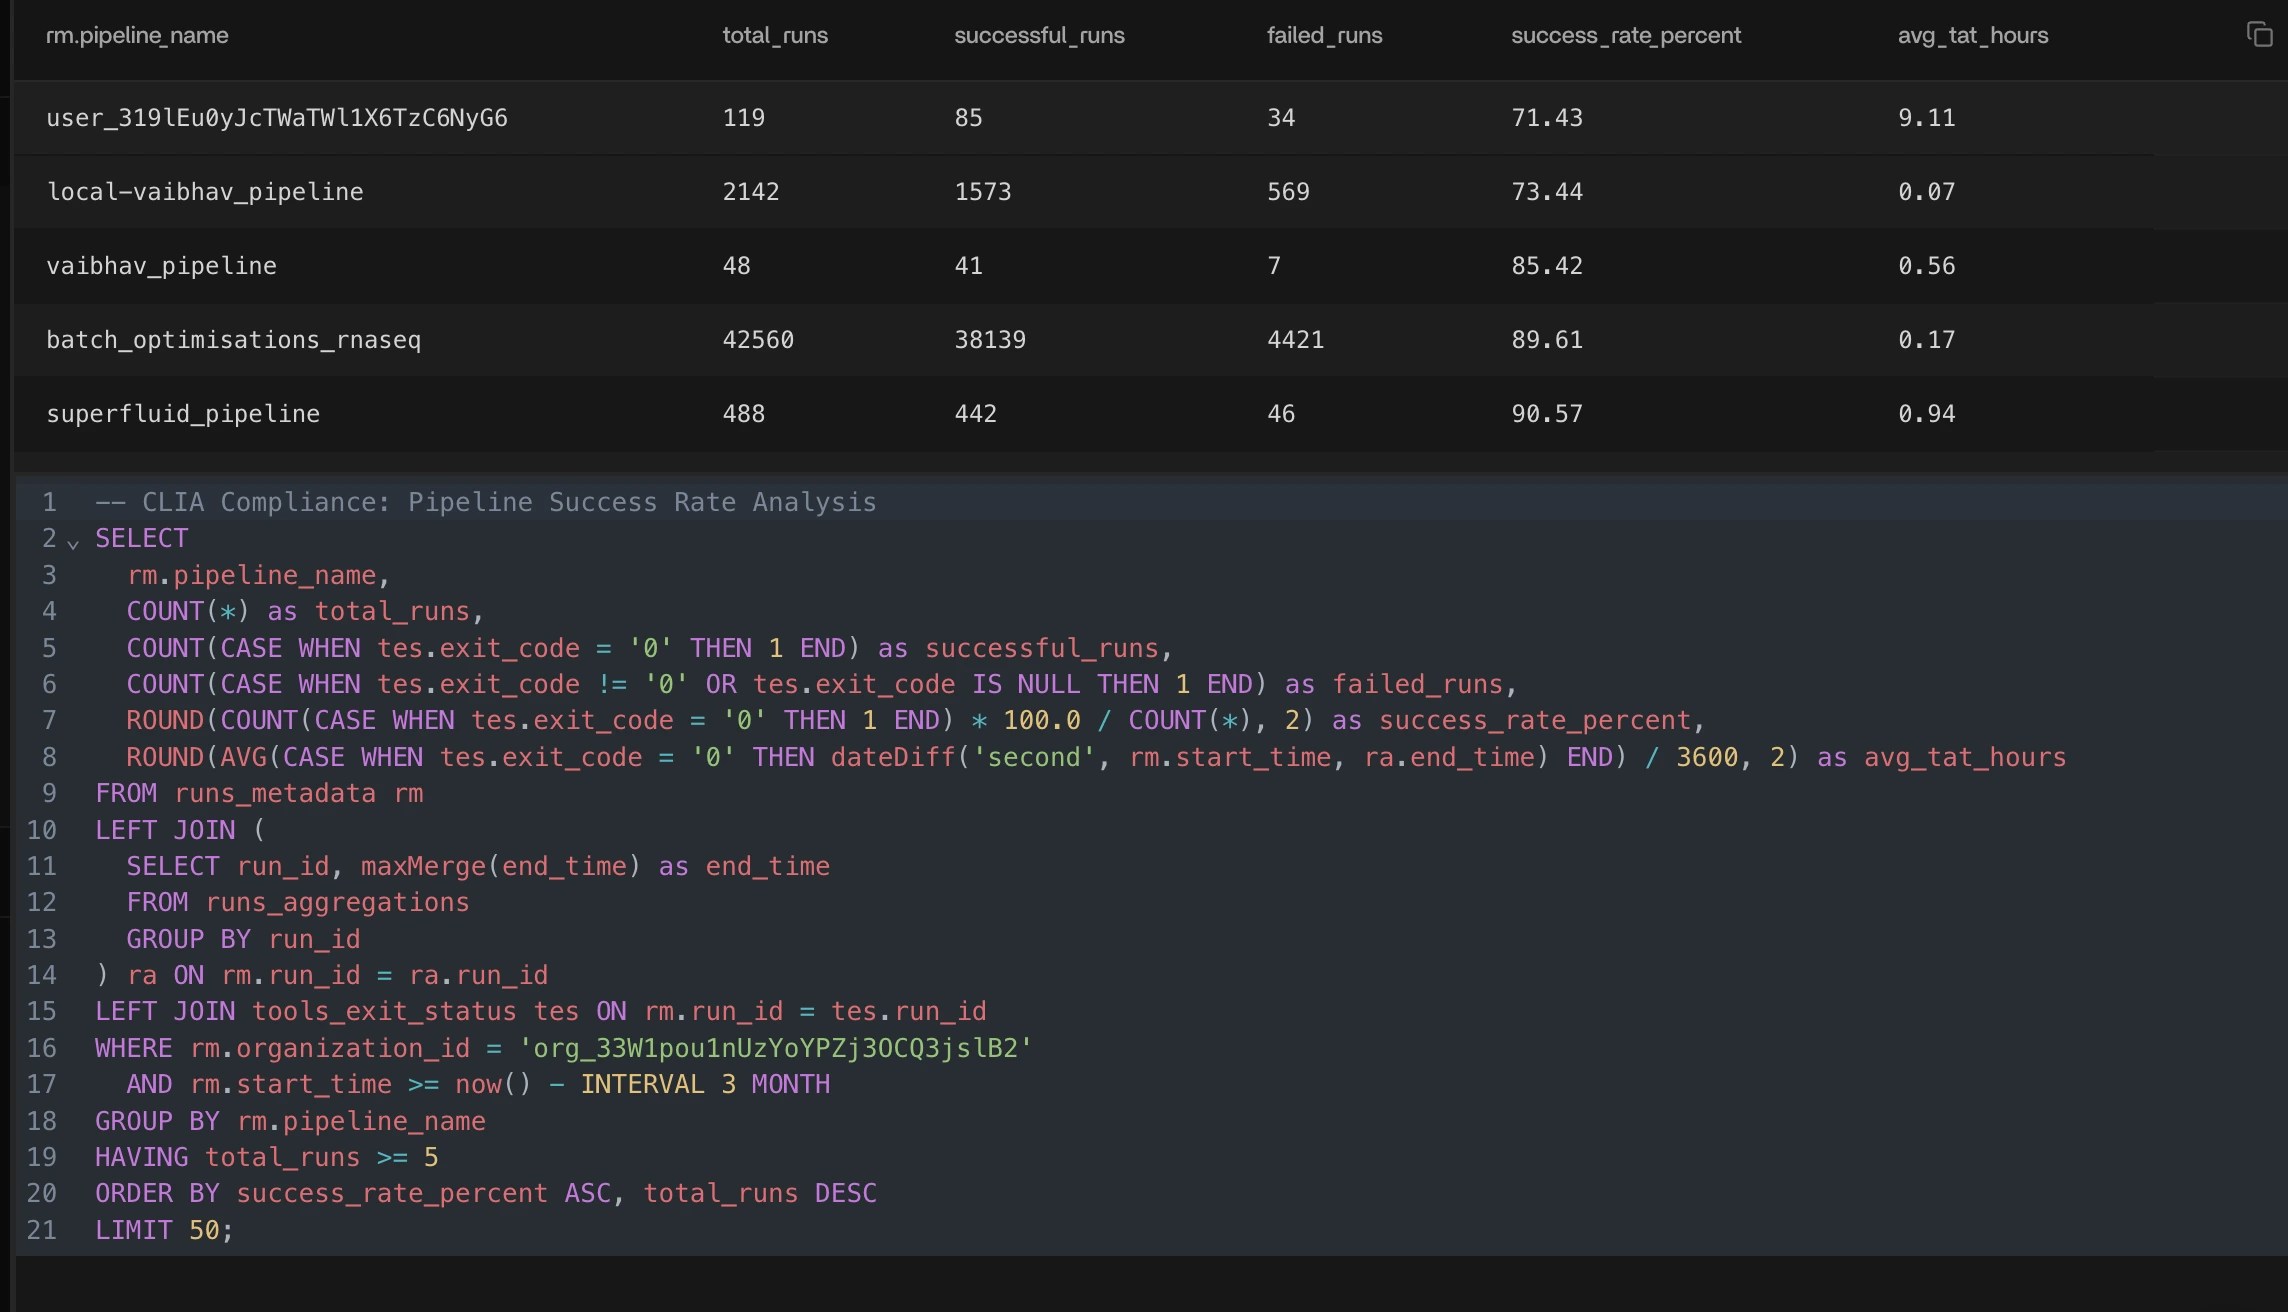
Most Expensive Pipelines
Identify your most expensive pipelines for any time window and surface the average cost per run to understand spend drivers.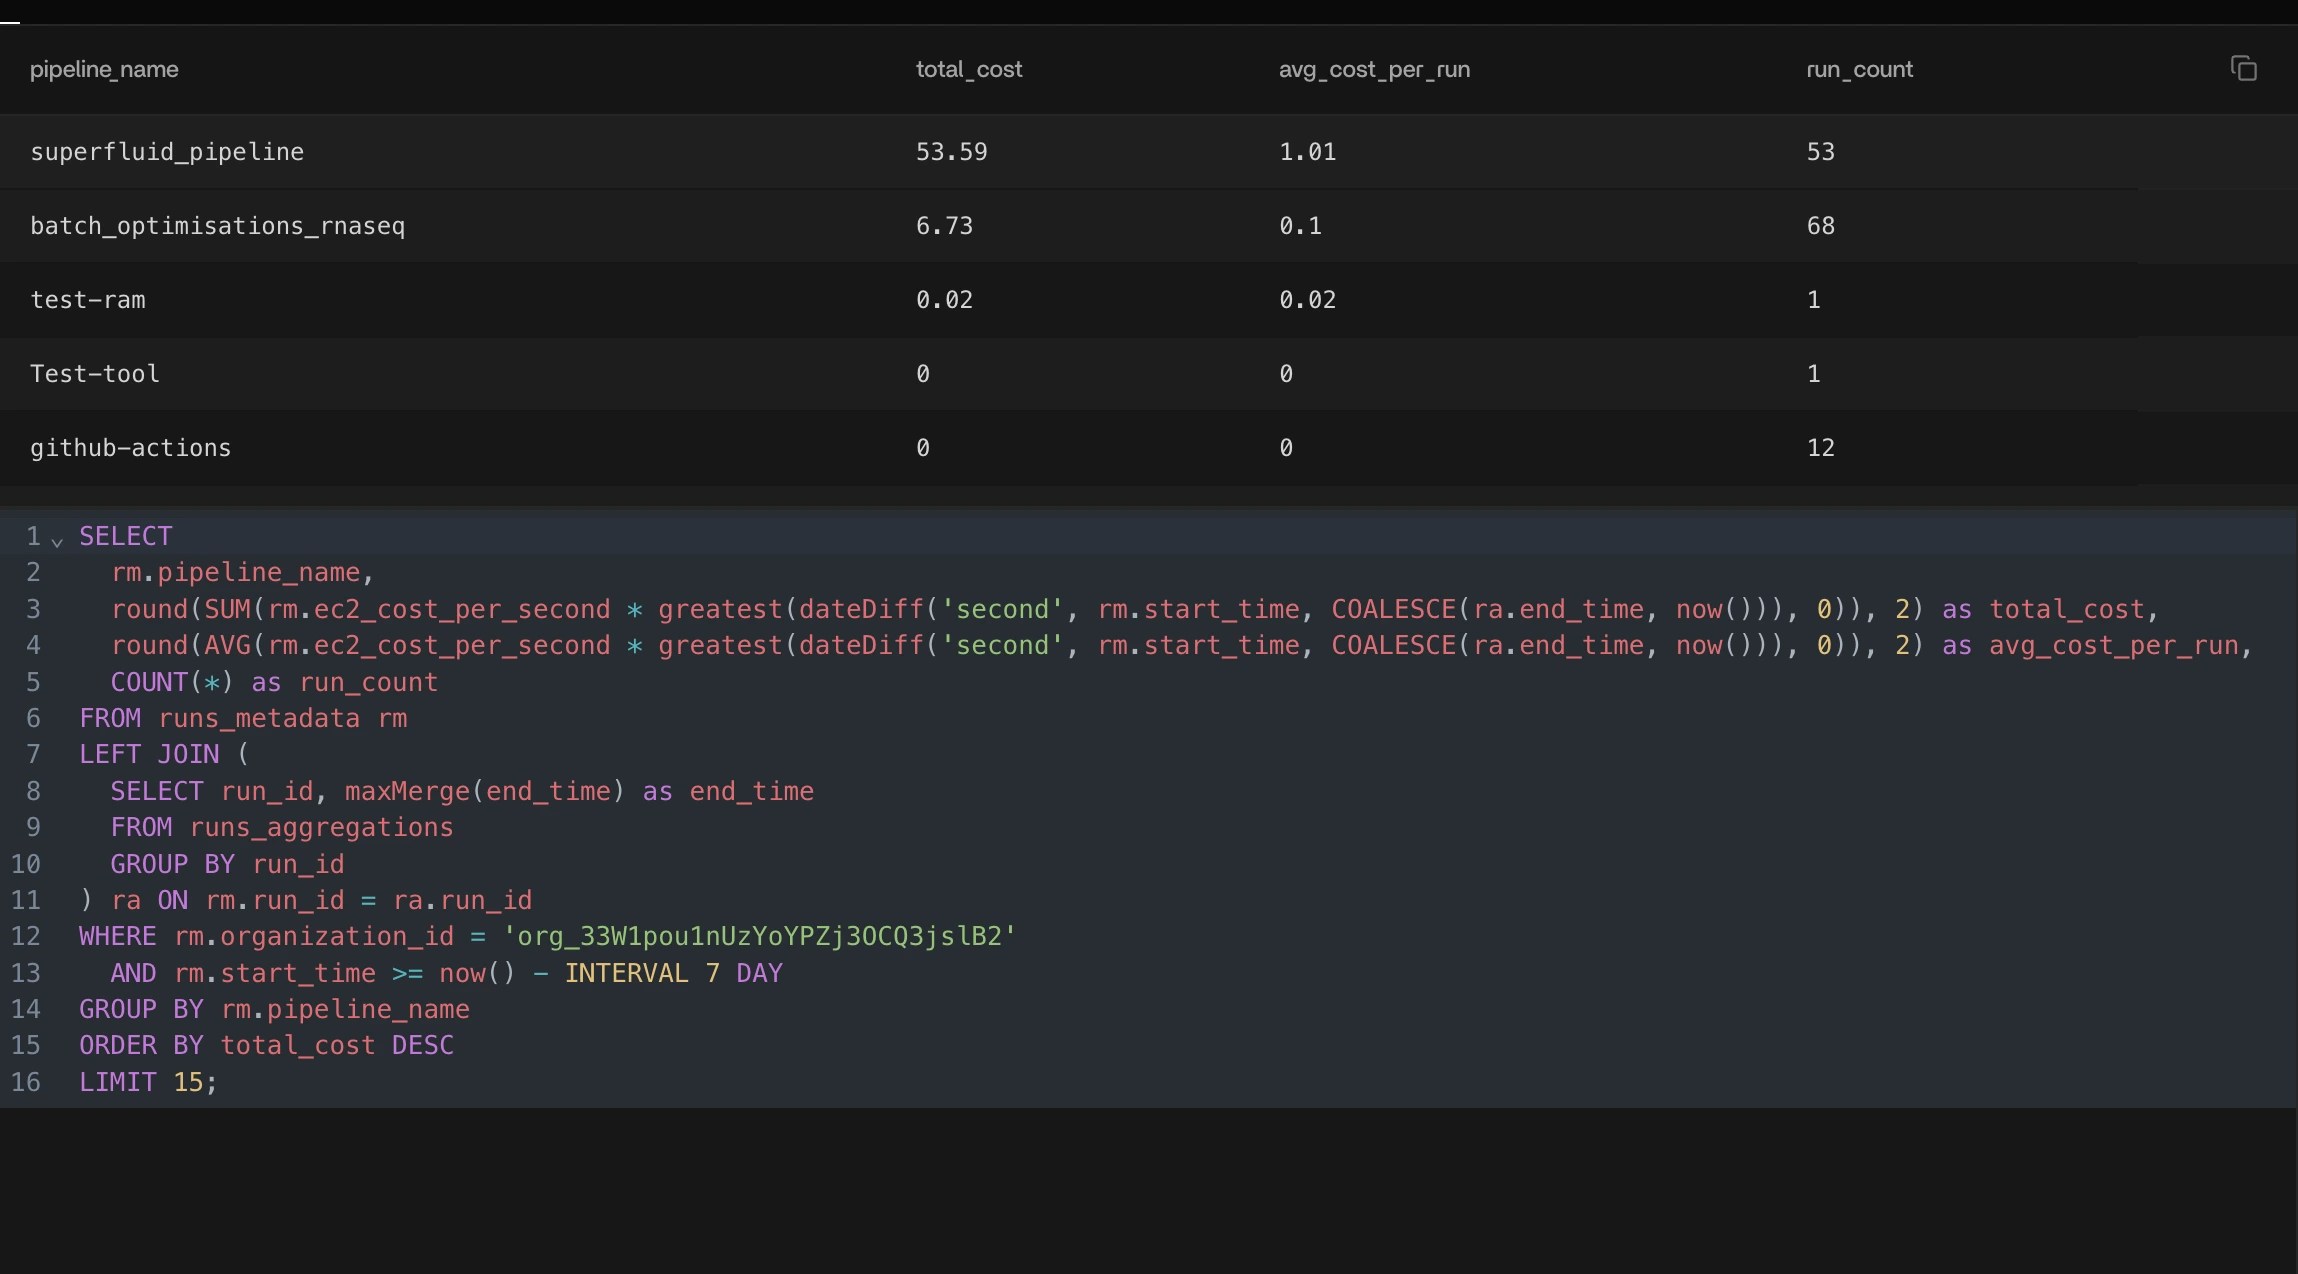
Pipeline Resource Utilization
Spot pipelines that consistently underuse allocated compute, helping you pinpoint wasted capacity and optimize resource allocation.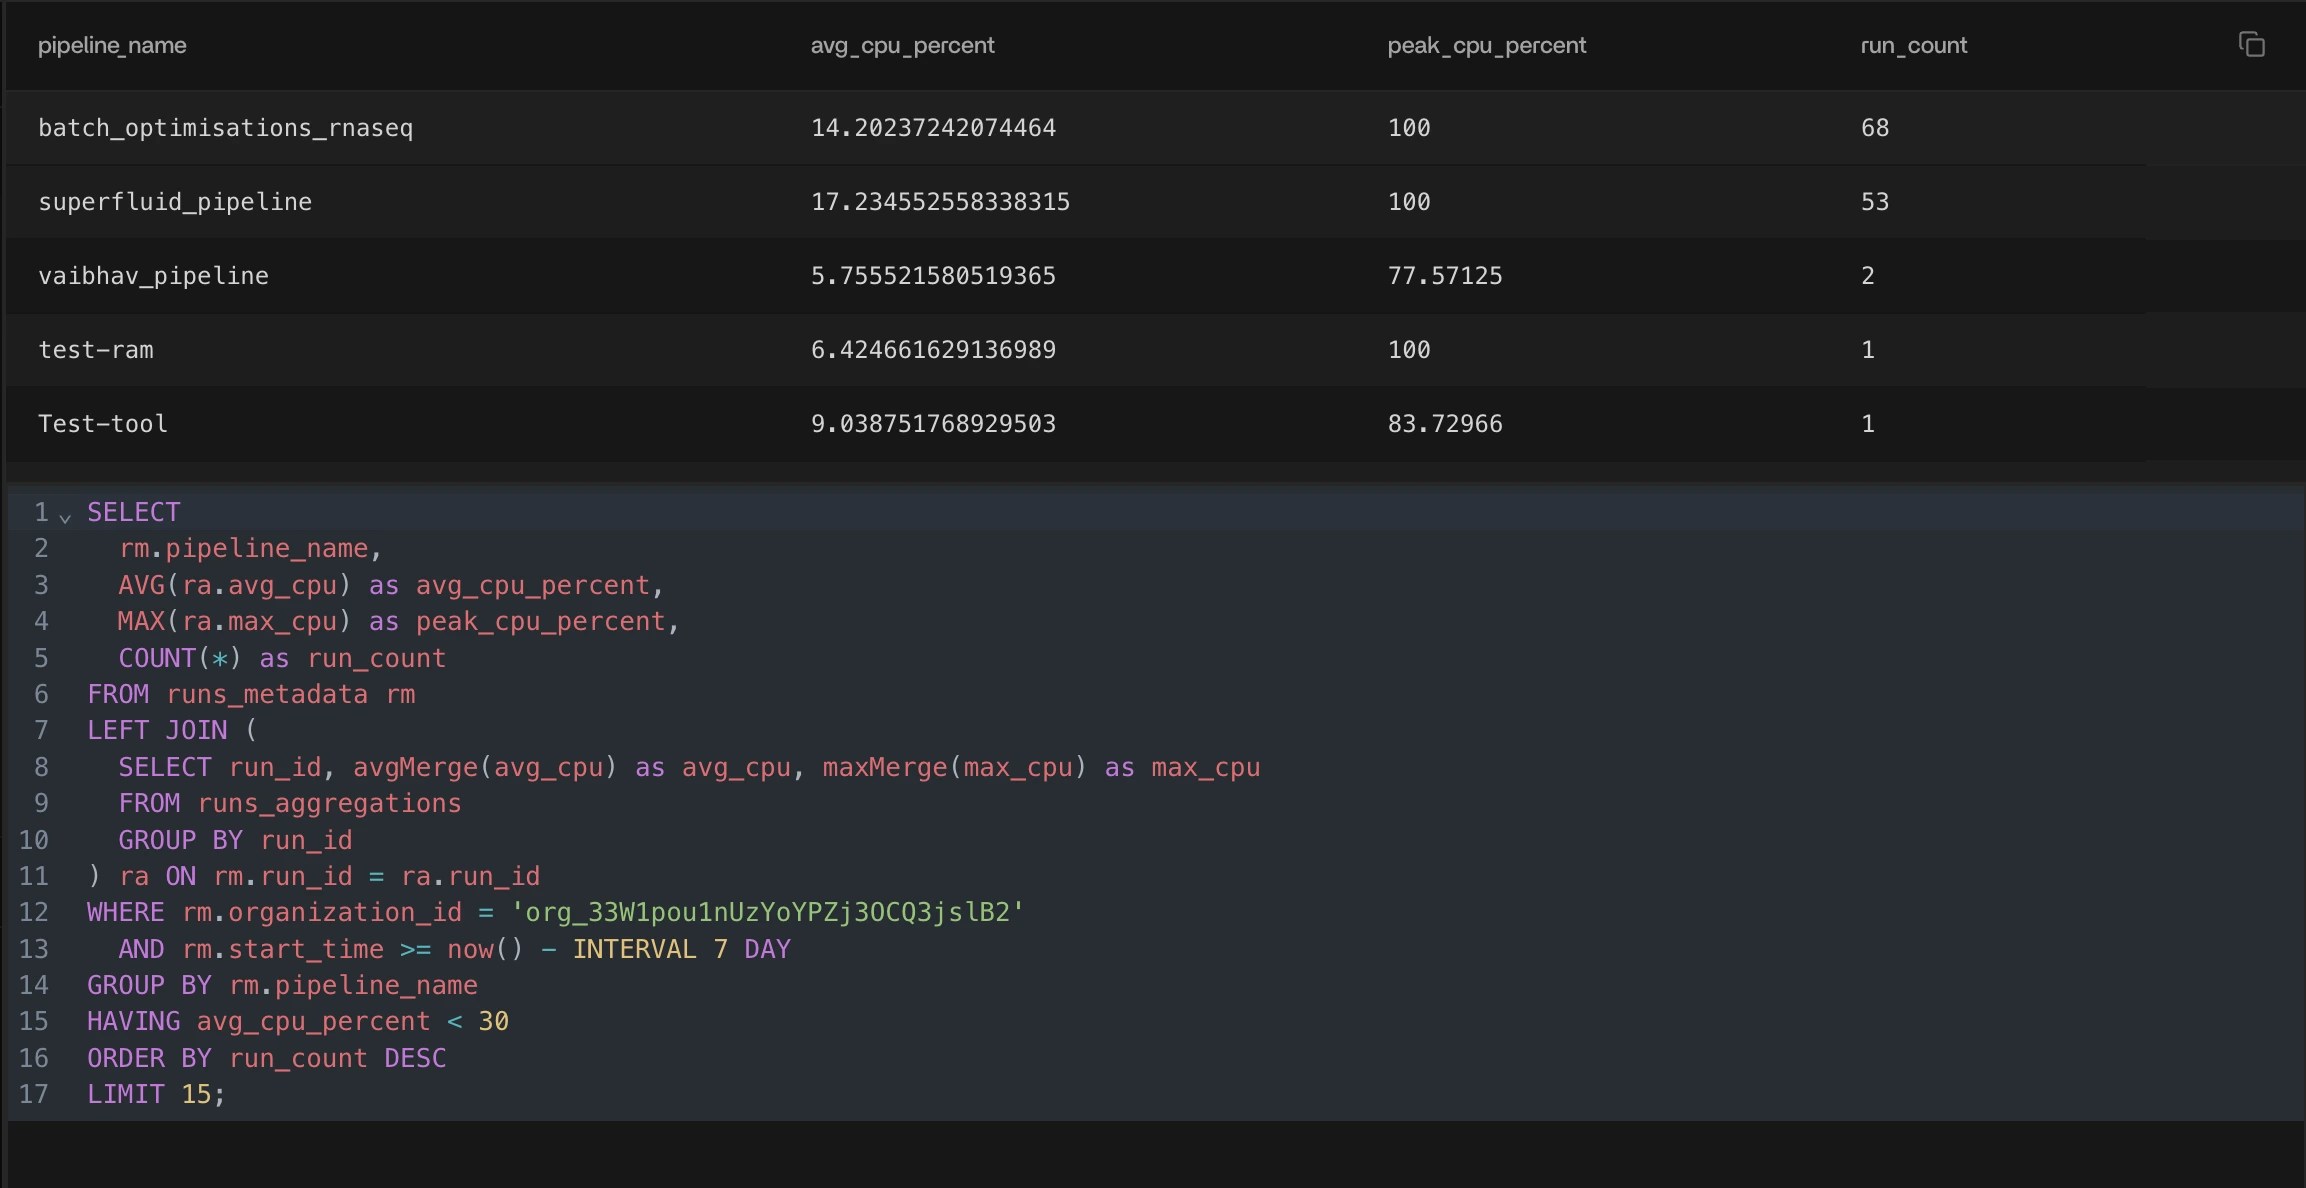
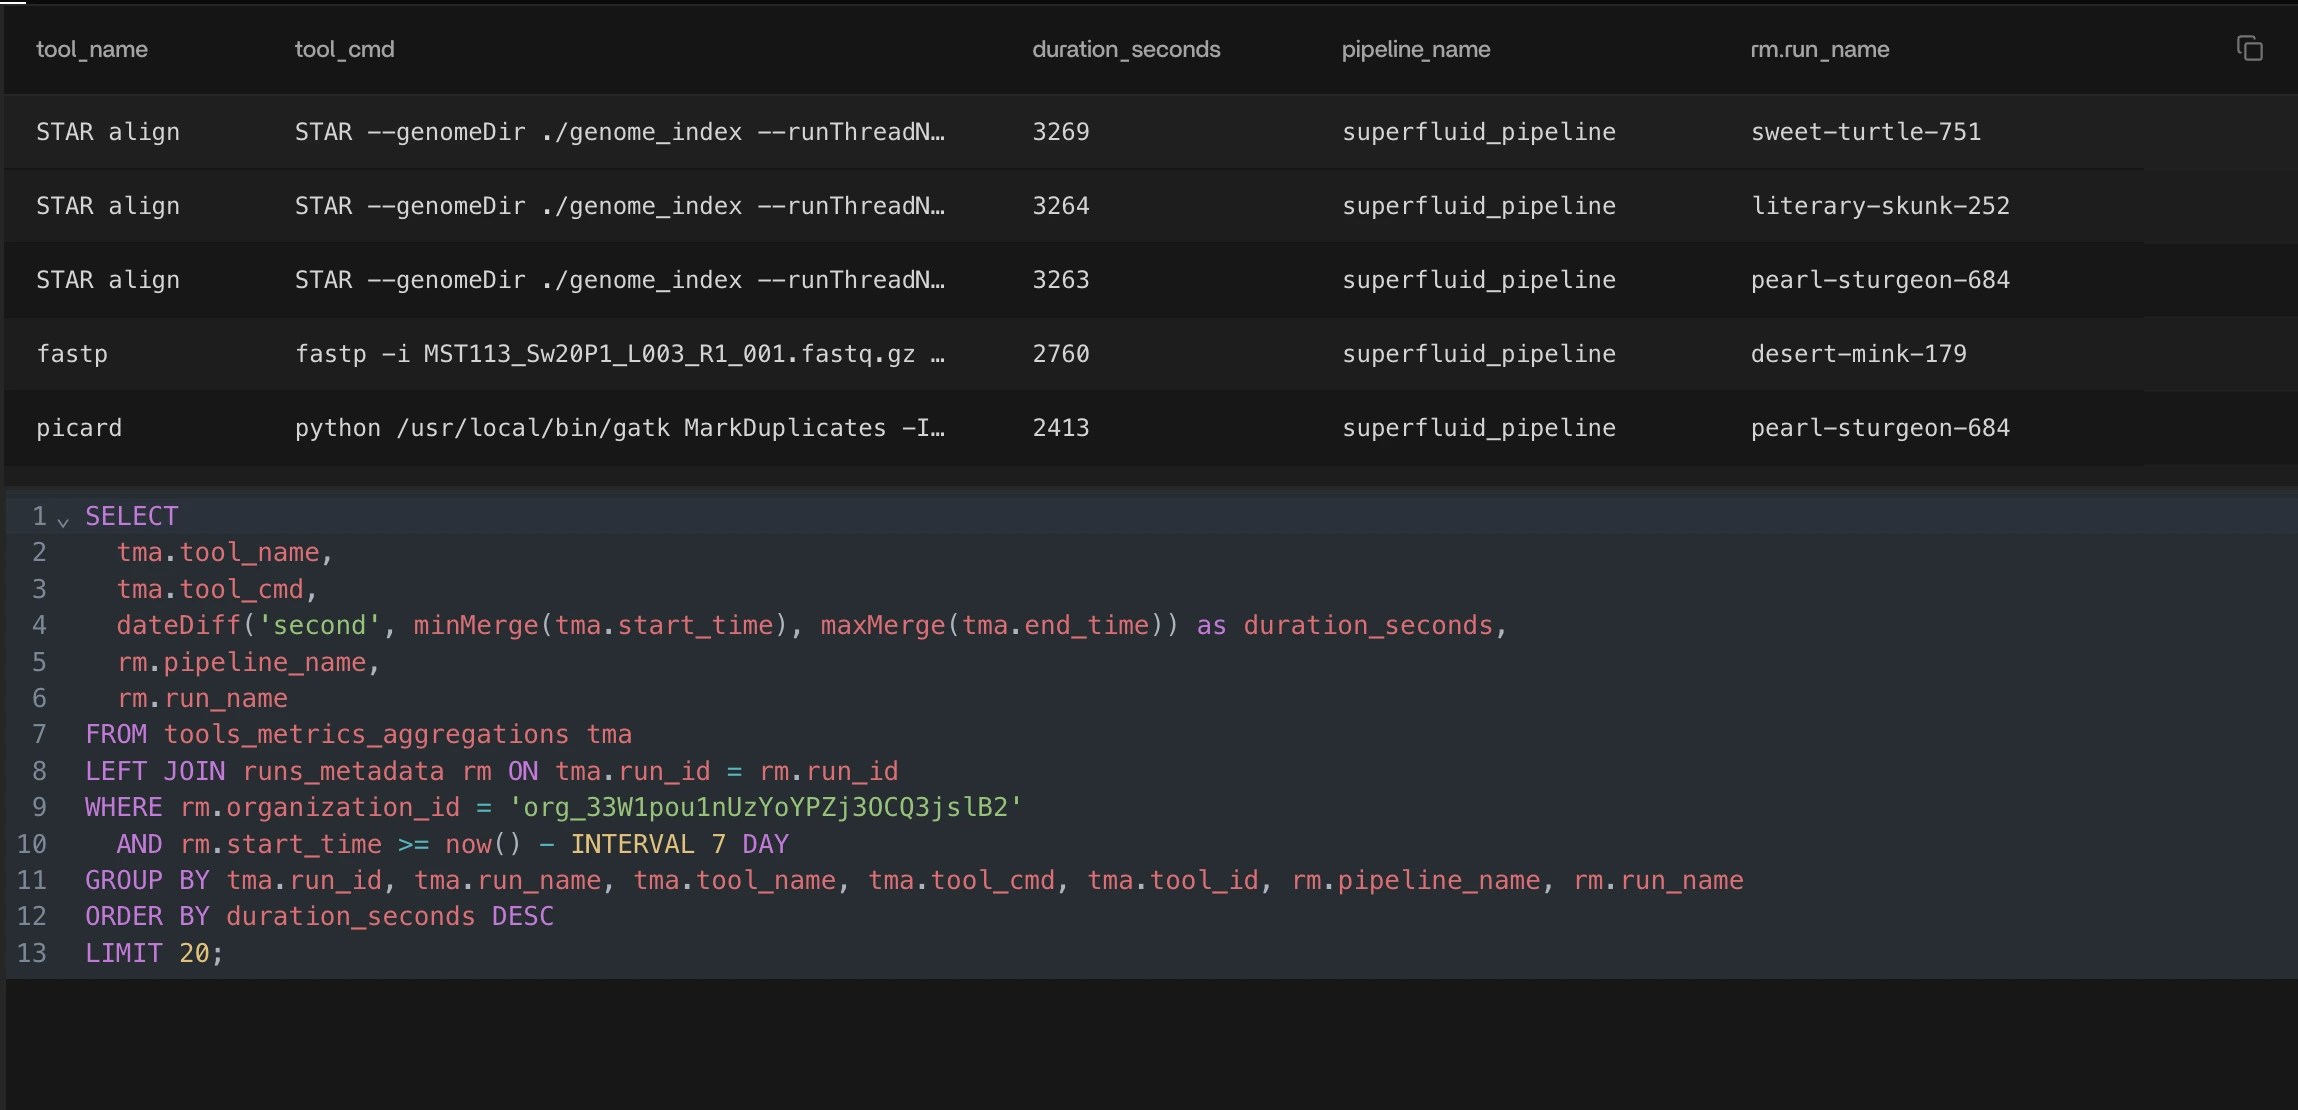
Longest Tool Execution
Surface the tools or steps that contribute the most to overall runtime, including the exact commands, so you know where to focus optimization efforts.