Tracer Technology Benefits
Tracer offers a set of core capabilities that improve visibility and analysis across scientific workflows compared to traditional monitoring tools:- Deep information: enabling faster and more accurate issue detection.
- Workflow-agnostic: Works with any workflow without required modifications.
- Advanced Features: driving up value creation such as resource and cost optimization
How Tracer Can Offer This
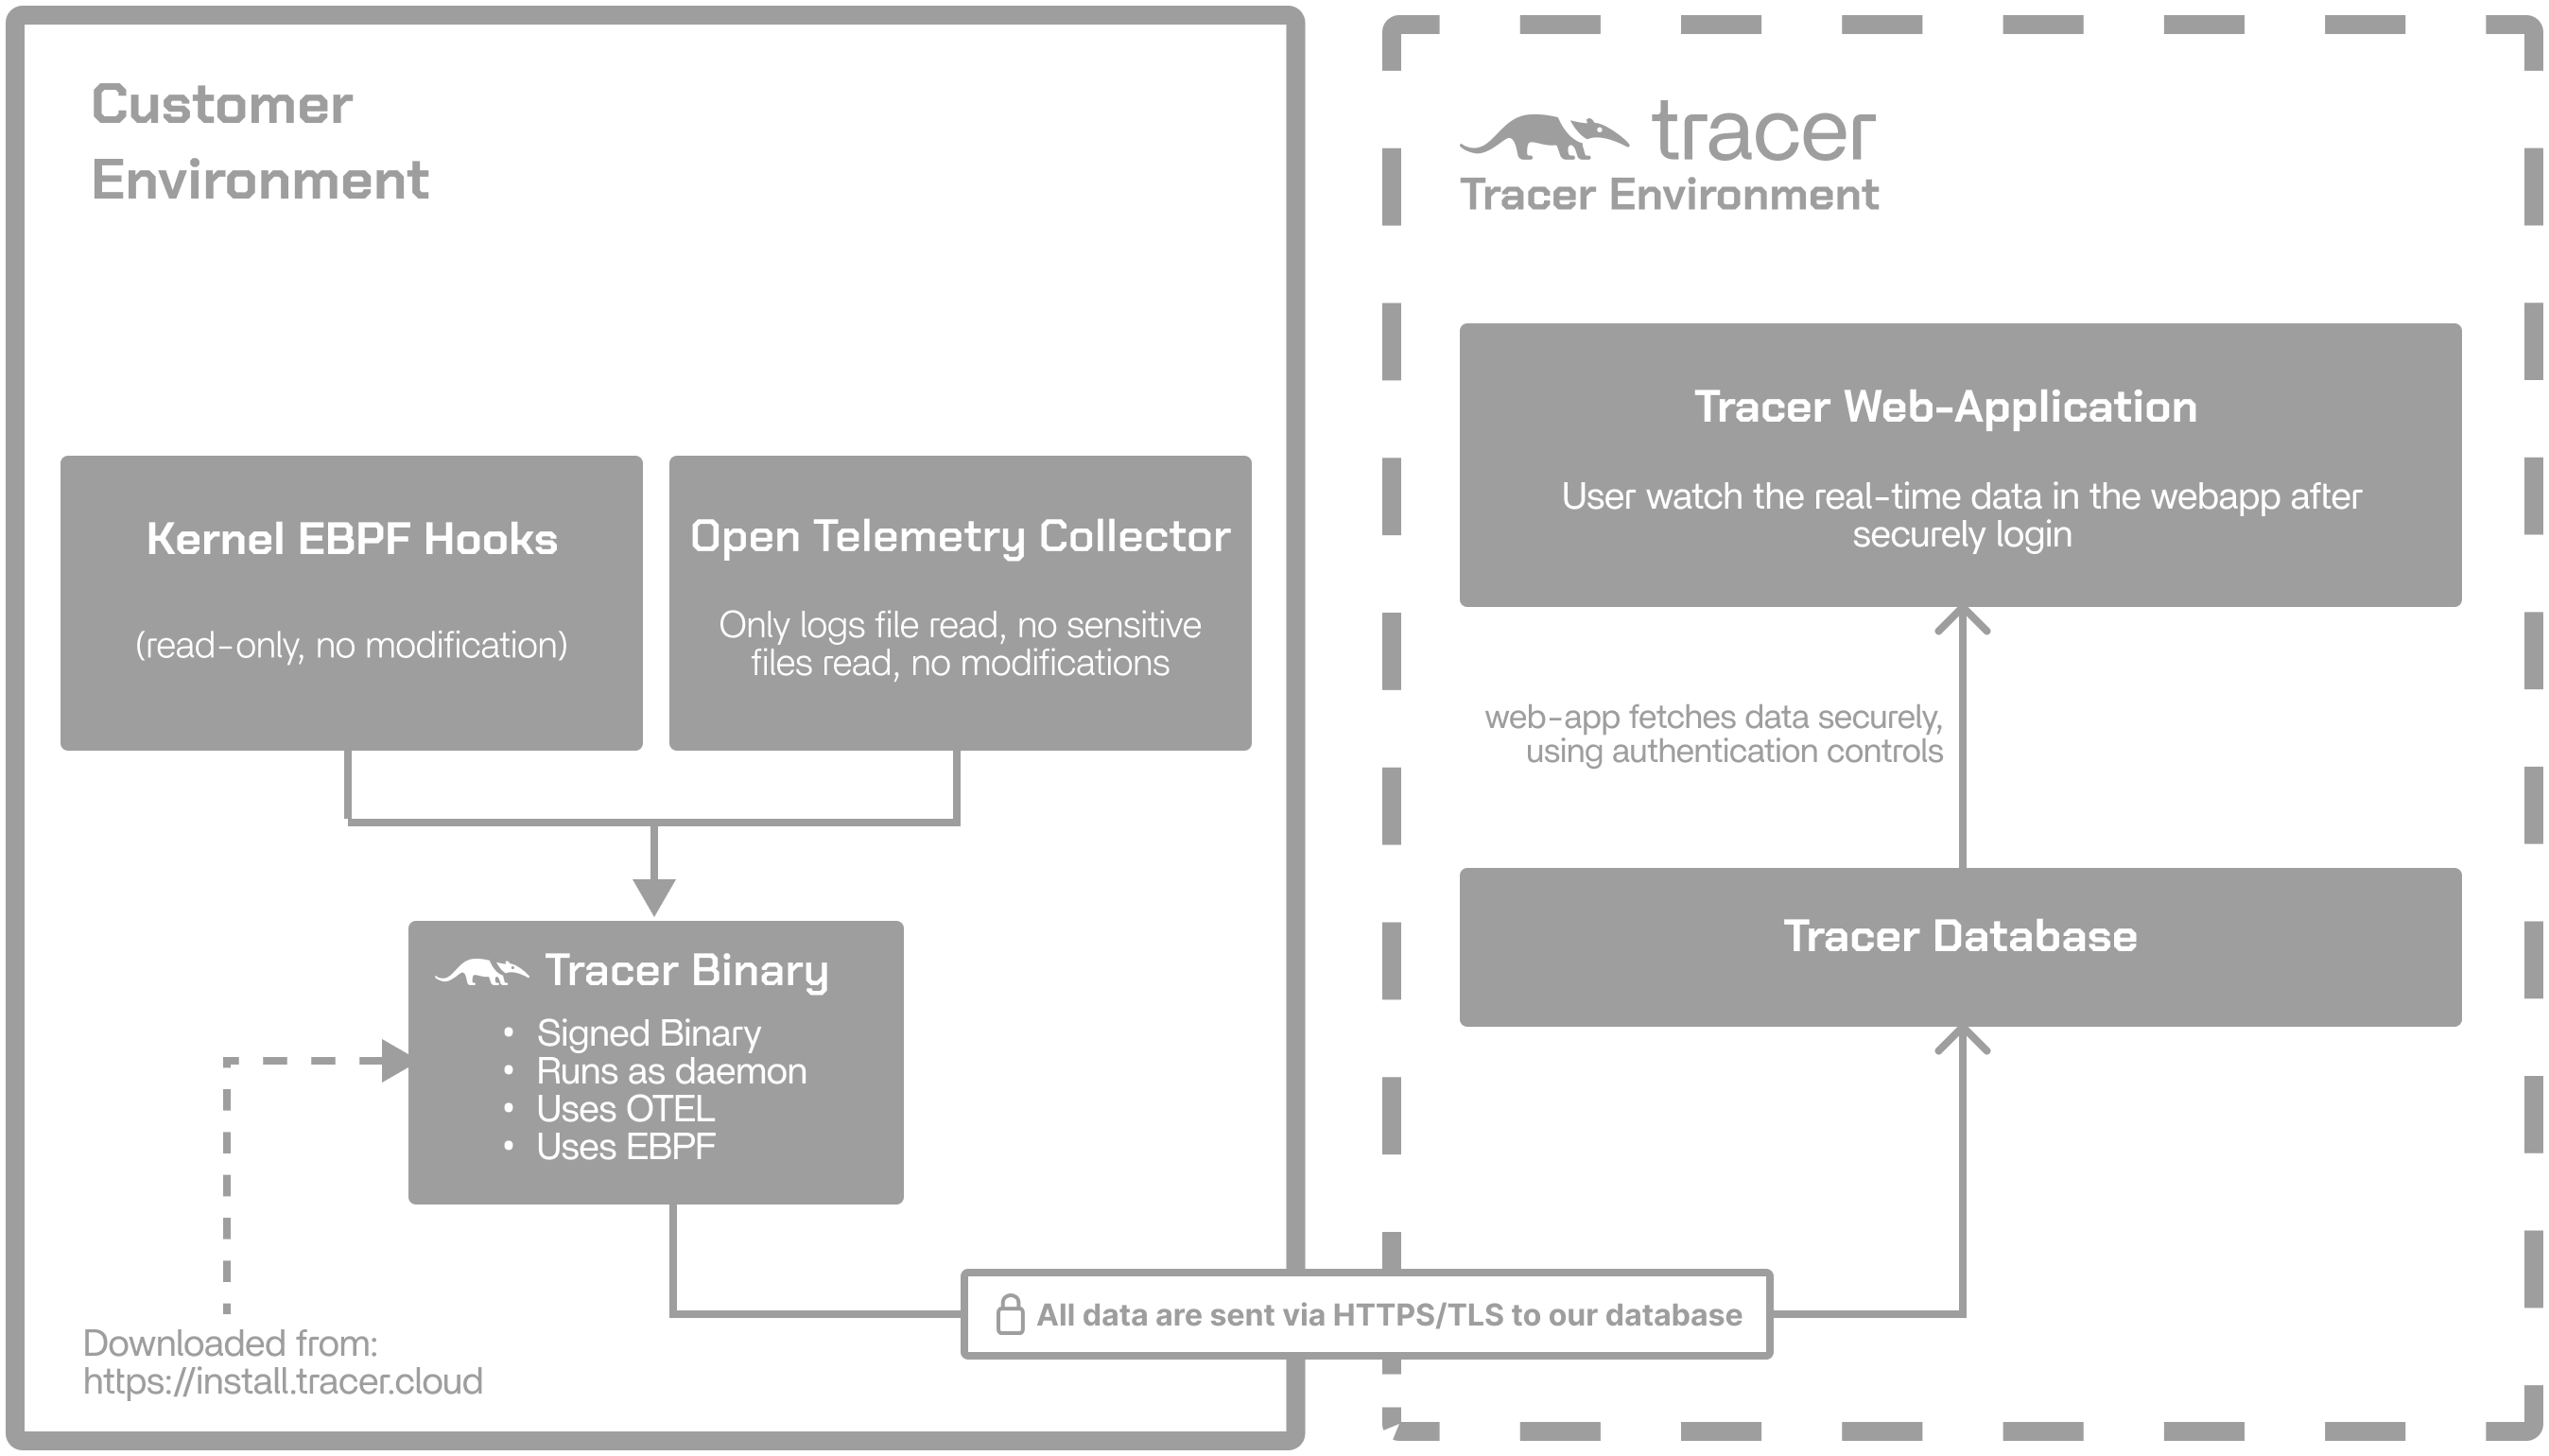
Tracer is built on top of eBPF (extended Berkeley Packet Filter), a Linux kernel technology that allows safe, high-performance instrumentation without kernel modifications. eBPF programs run inside the kernel and expose detailed telemetry to Tracer’s runtime, which correlates system events with pipeline steps, tools, and samples. Below is a high-level view of how Tracer uses eBPF during development and runtime:

Development
eBPF programs are compiled into safe bytecode and validated by the kernel’s verifier. Tracer distributes precompiled, architecture-compatible eBPF modules through its Go-based agent, so no user compilation is required.Runtime
At runtime, Tracer’s eBPF modules attach to system call boundaries, network operations, scheduling events, and other kernel hooks. Using eBPF Maps, Tracer aggregates telemetry efficiently and streams enriched metrics to its backend. This enables:- Per-tool and per-task CPU/I/O visibility
- Real-time failure attribution
- Identification of idle or stuck processes
- Network and storage performance insights
- Cost and resource usage mapping at sample, step, and pipeline levels
Why eBPF
Understanding why Tracer uses eBPF for observability Traditional approaches rely on logs, metrics exporters, or code instrumentation. eBPF serves four main purposes for Tracer:See everything System calls, process lifecycle, I/O, and scheduling events | Stay lightweight Sampling at kernel level without copying large data |
Stay safe Verified, sandboxed bytecode that cannot crash your node | Stay universal Works with any container, binary, or programming language |
How Tracer works, next to eBPF
Tracer observes pipeline execution directly at the OS level using eBPF and a multi-layer data processing architecture. The workflow consists of four main stages:Attach
The Tracer agent attaches non-intrusively to running processes and containers. No restarts, code changes, or wrapper scripts are required.
Collect
Using eBPF, the agent captures granular system-level signals, including CPU scheduling delays, I/O operations, memory activity, GPU context switches, and other kernel events, while maintaining low overhead.
Correlate
Captured events are mapped back to the structure of the pipeline, including jobs, tasks, and steps. This provides context for understanding runtime behavior across diverse tools and workflow engines.