

Why Tracer uses eBPF
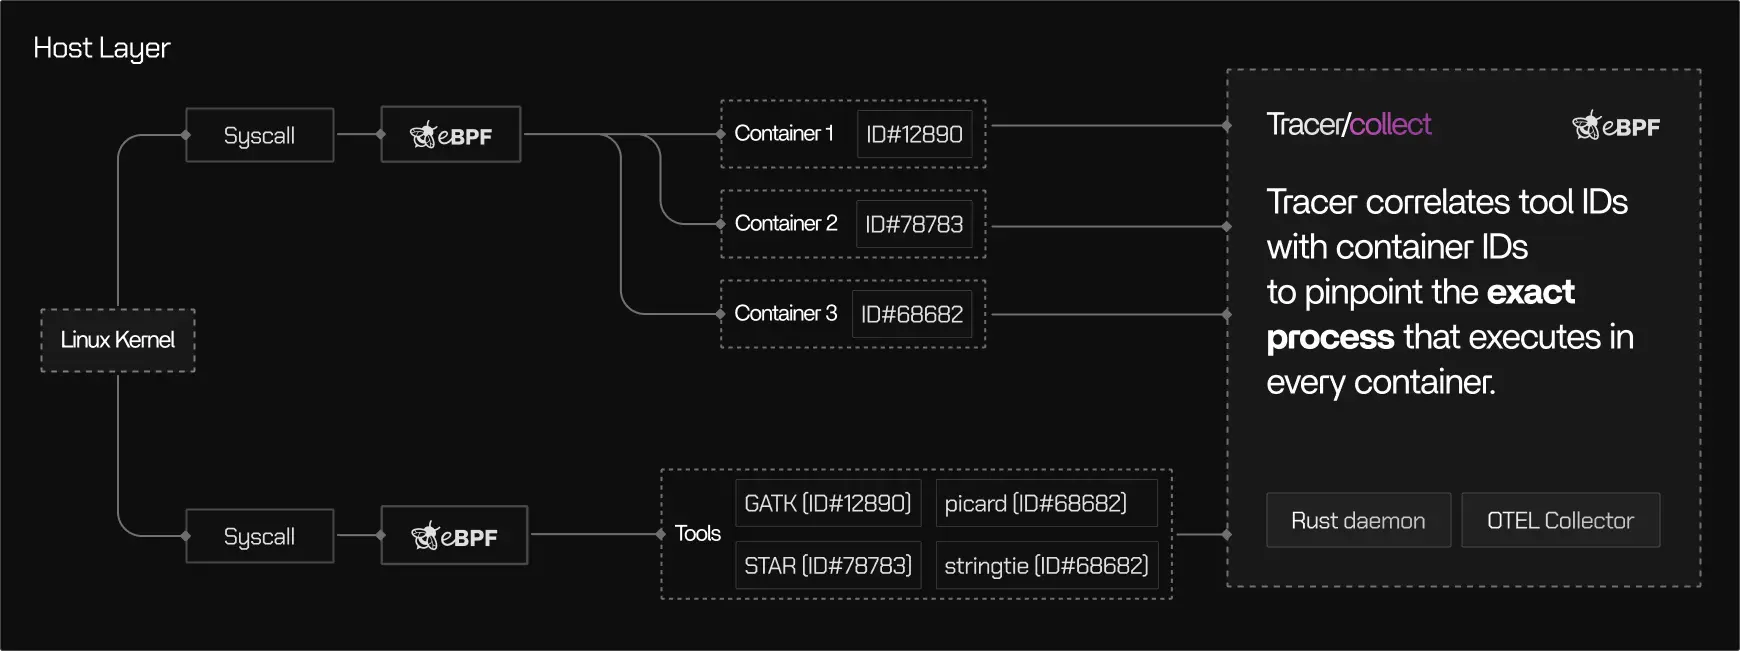
Traditional observability approaches depend on logs, metrics exporters, or application-level instrumentation. These methods rely on what software chooses to expose and often miss behavior in short-lived processes, external binaries, or between metric collection intervals. eBPF allows Tracer to observe execution where it actually happens, at the boundary between user processes and the operating system. Using eBPF, Tracer can:- Observe syscalls, scheduling events, and I/O activity
- Track process lifecycles across containers and hosts
- Capture execution behavior without modifying application code
- Work across languages, frameworks, and binaries
Safety model
eBPF programs are subject to strict safety constraints enforced by the Linux kernel. Tracer’s use of eBPF follows these principles:Verified bytecode
Verified bytecode
All eBPF programs are validated by the kernel verifier before execution. Programs that fail verification cannot run.
Sandboxed execution
Sandboxed execution
eBPF programs run in a restricted environment and cannot access arbitrary memory or crash the kernel.
No kernel modifications
No kernel modifications
Tracer does not load kernel modules or modify kernel code.
Controlled attachment points
Controlled attachment points
Tracer attaches only to well-defined kernel hooks such as system call boundaries and scheduler events.
What Tracer observes
Tracer observes execution metadata, not application data.CPU & scheduling
CPU usage and scheduling behavior
Memory
Memory usage and peak memory
I/O activity
Disk and network I/O activity
Process lifecycle
Process start, stop, and parent–child relationships
Container context
Container, namespace, and cgroup context
What Tracer does not observe
While Tracer can observe which binaries and commands were executed, it does not inspect the data those commands operate on or infer application semantics.Data handling and isolation
Tracer separates data collection from analysis.- Execution signals are captured locally and processed into structured telemetry
- Only metadata required for analysis is transmitted
- Payload data is never inspected or exported
- Correlation is based on operating system identifiers (PIDs, cgroups, namespaces)
Performance considerations
Tracer’s eBPF-based collection is designed to minimize overhead:Low latency
eBPF probes execute in kernel space with low latency
Efficient filtering
Event filtering reduces data volume at the source
Scales well
Collection overhead remains low even with many short-lived processes
No re-runs
No pipeline re-runs are required to obtain telemetry
Measured overhead depends on workload characteristics but is typically low enough for continuous use in production environments.
Security boundaries
Tracer is intentionally scoped. Security ownership remains with the operating system, container runtime, and cloud provider. Tracer observes execution behavior within those boundaries.When to read this page
This page is most relevant if you:- Need to understand how Tracer observes execution safely
- Operate in regulated or security-sensitive environments
- Evaluate eBPF-based tooling for production systems
- Want clarity on what data Tracer does and does not collect