Getting started
Installation requires no code changes
Tracer installs with a single command and takes another command to run.- No changes to your scripts, workflow definitions, containers, or environments.
- Once installed, your next run is visible automatically.
Observability
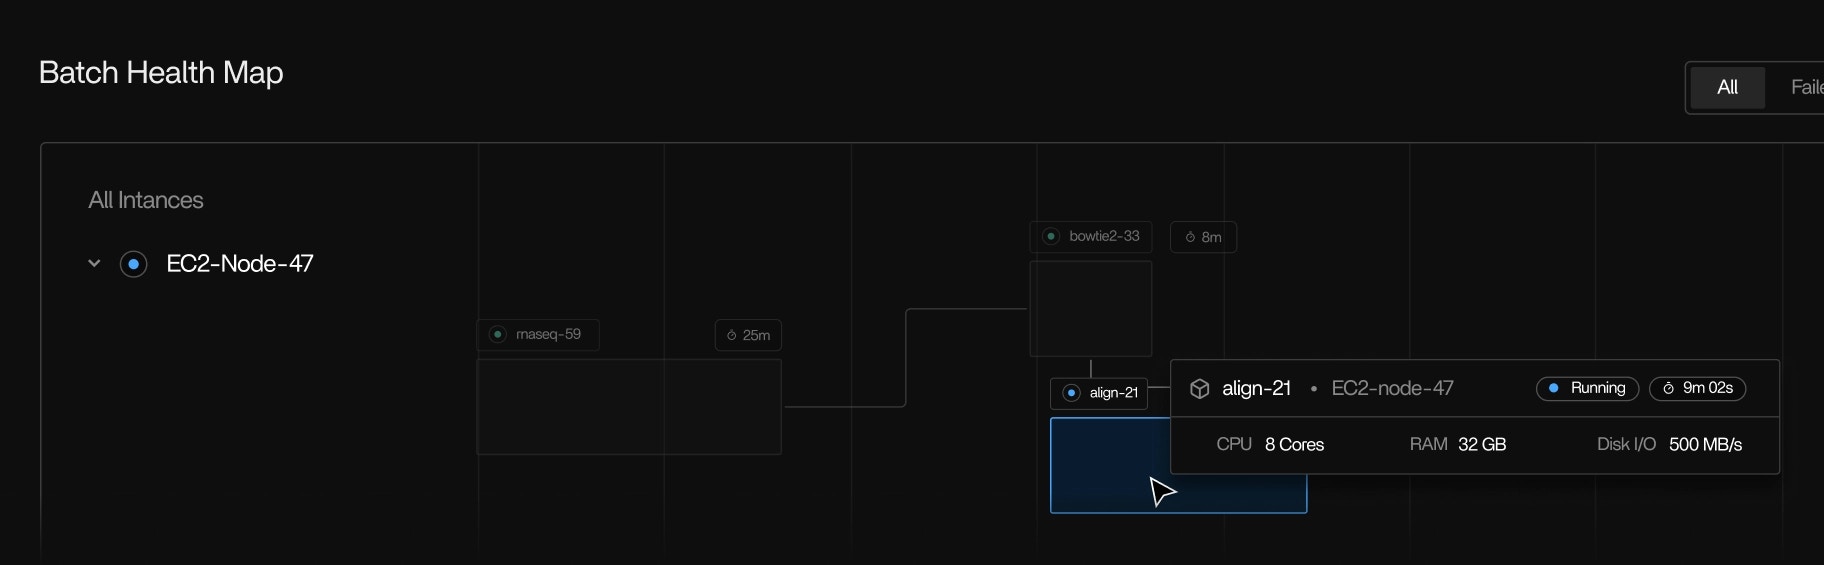
Runtime view
- Every run currently executing
- Steps, tools, and subprocesses
- Start and stop times
- Resource usage over time
- Container lifecycle events
Tool and binary detection
- Native executables
- Python-spawned processes
- Java tools
- Shell commands
- Long-lived and short-lived child processes
Even tools that don’t produce logs will still appear with complete runtime information.
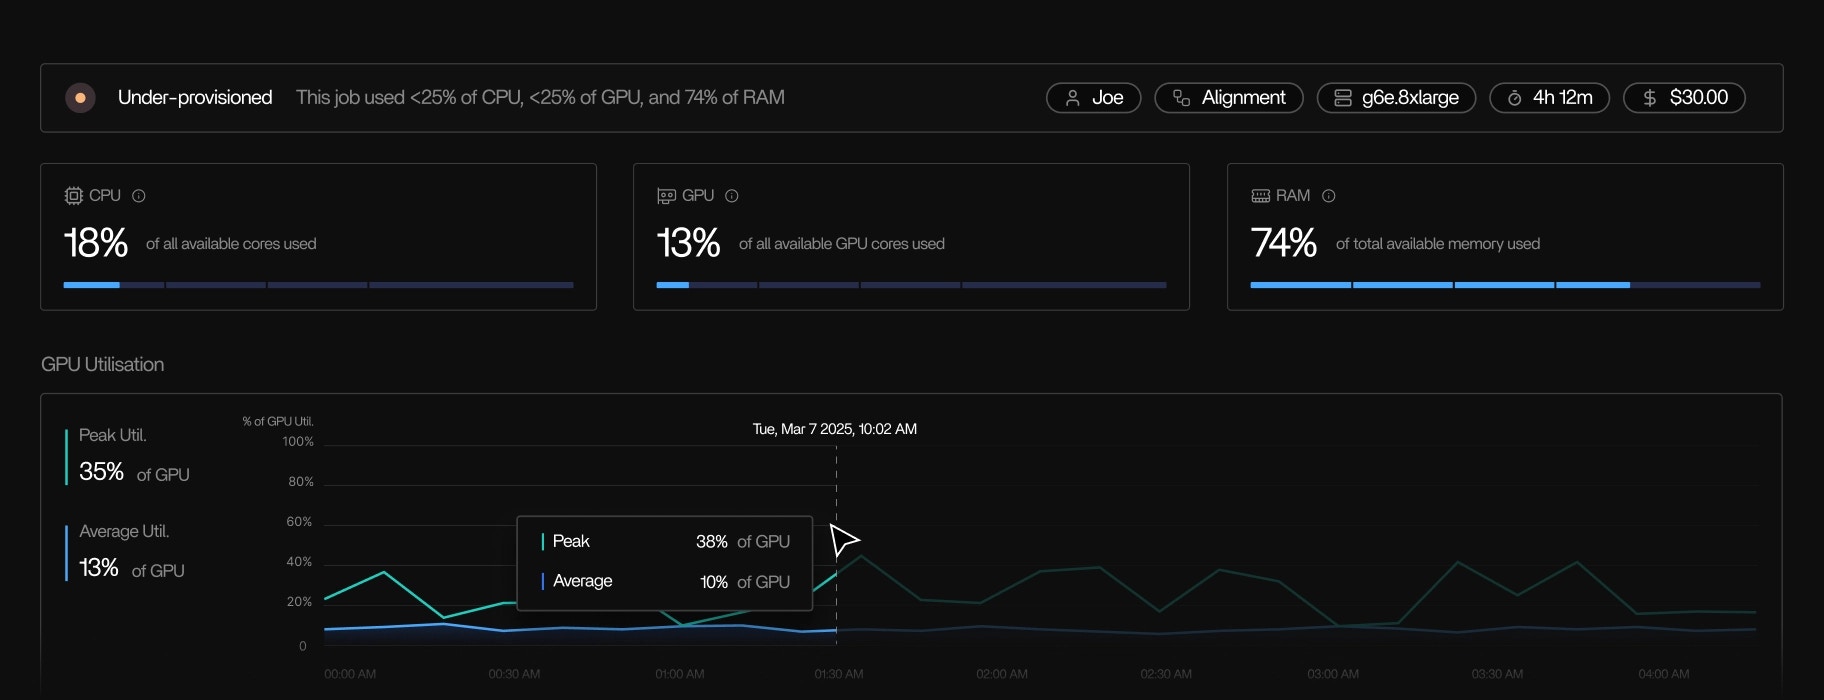
Kernel-level telemetry
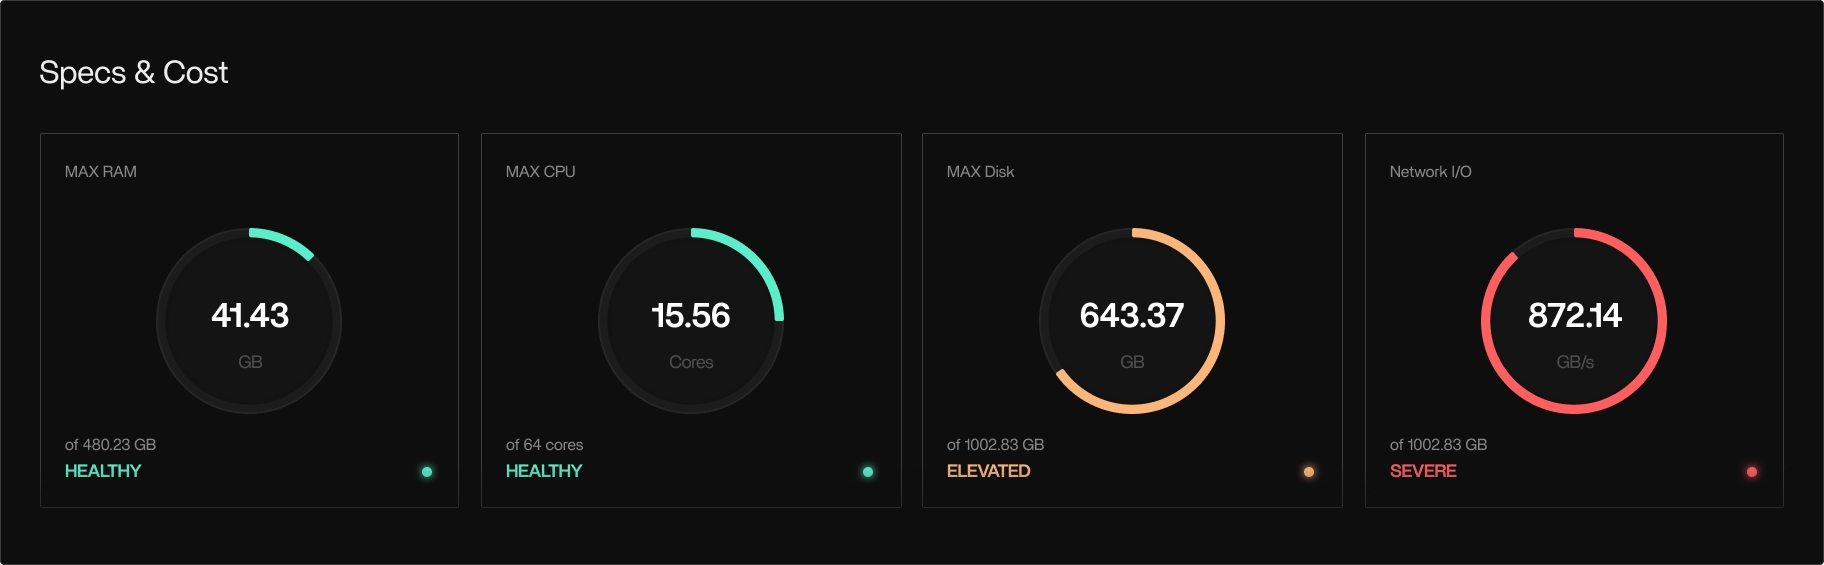
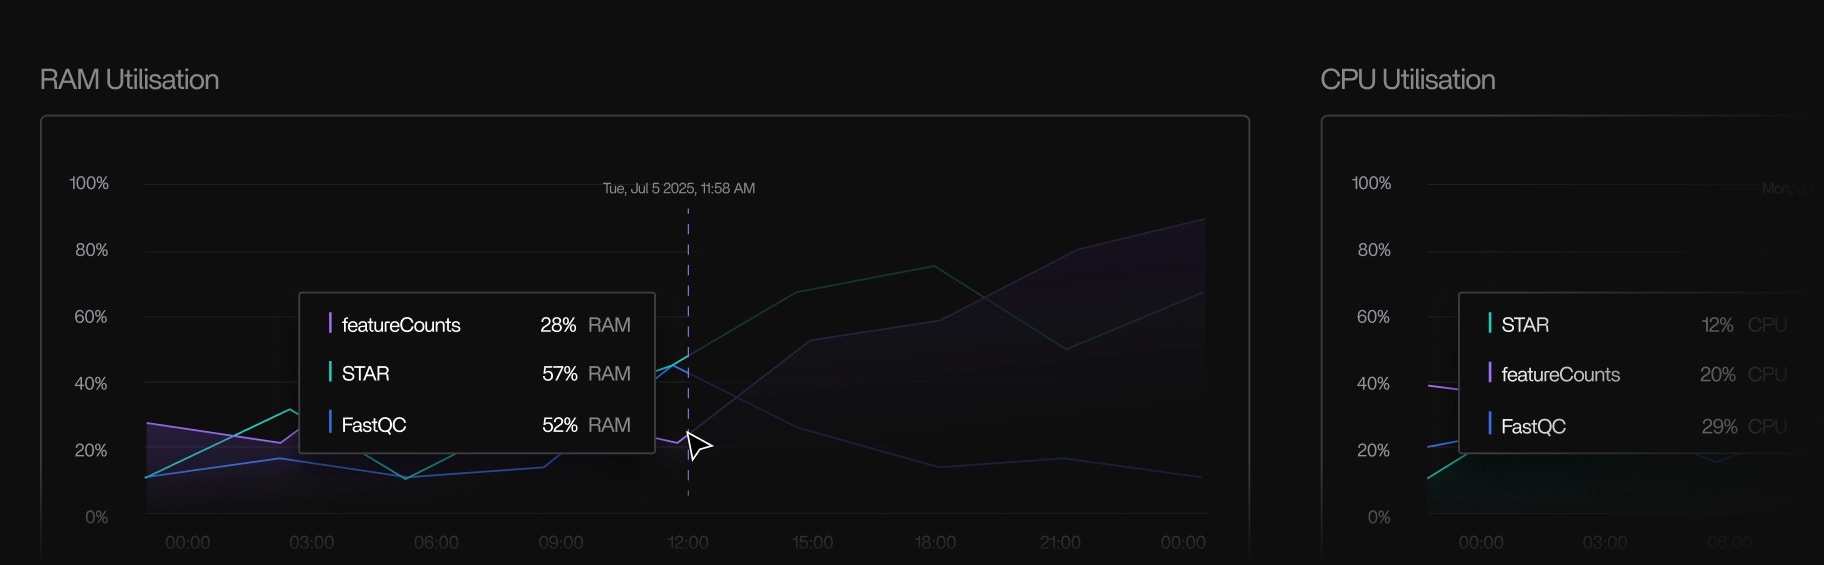
- CPU usage
- Memory usage and peak memory
- Disk I/O
- I/O wait
- Network activity
- Syscall-level metadata
- Out-of-memory kill events
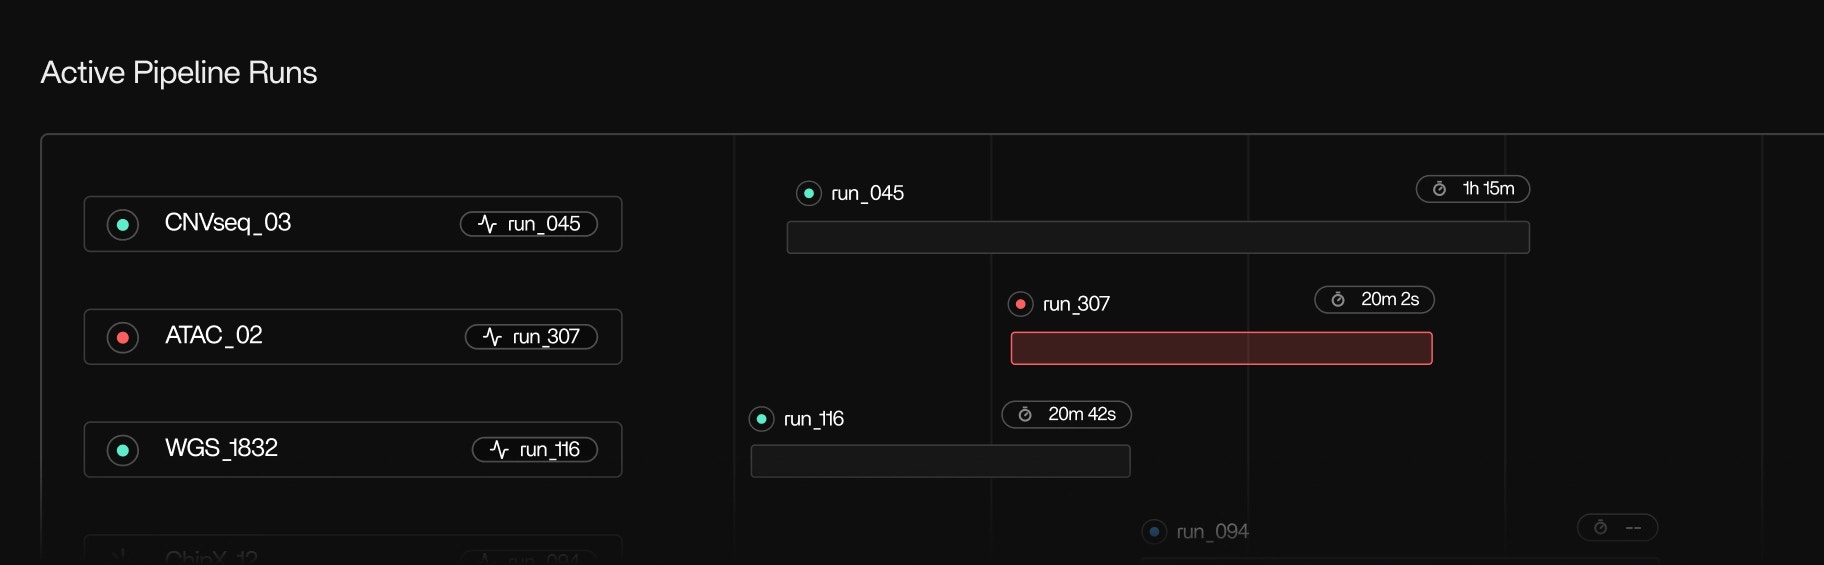
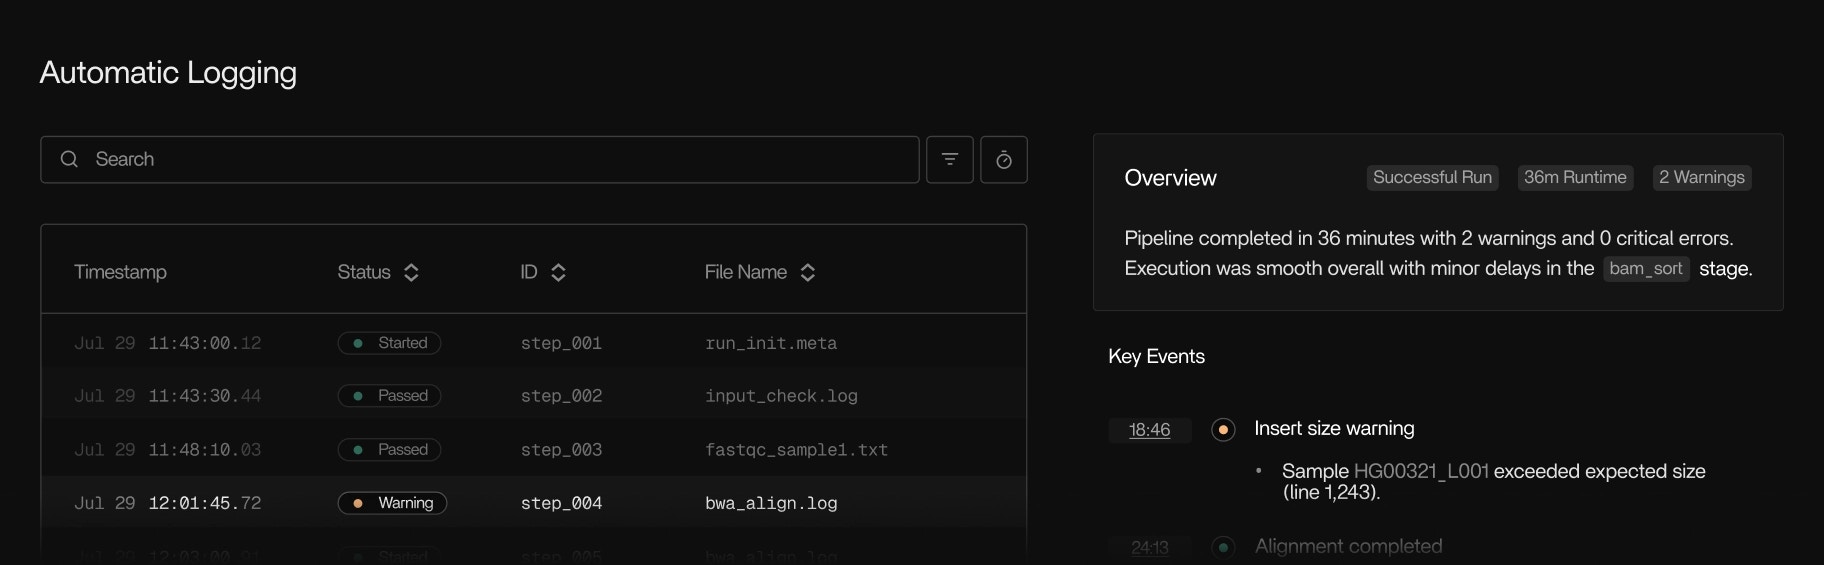
Full pipeline overview in real-time
View every pipeline run as it happens. See which steps, tools, and samples are running, queued, or completed, along with their current resource usage, expected runtime, and recent progress. Tracer highlights steps that are stalled, making no forward progress, running significantly slower than usual, or consuming abnormal CPU, memory, or I/O. You can follow each step from start to finish, watch new subprocesses appear in real time, and understand how work is distributed across your nodes, without checking logs, SSH’ing into machines, or waiting for workflows to finish.Automatic logging
Debugging
Failure signals
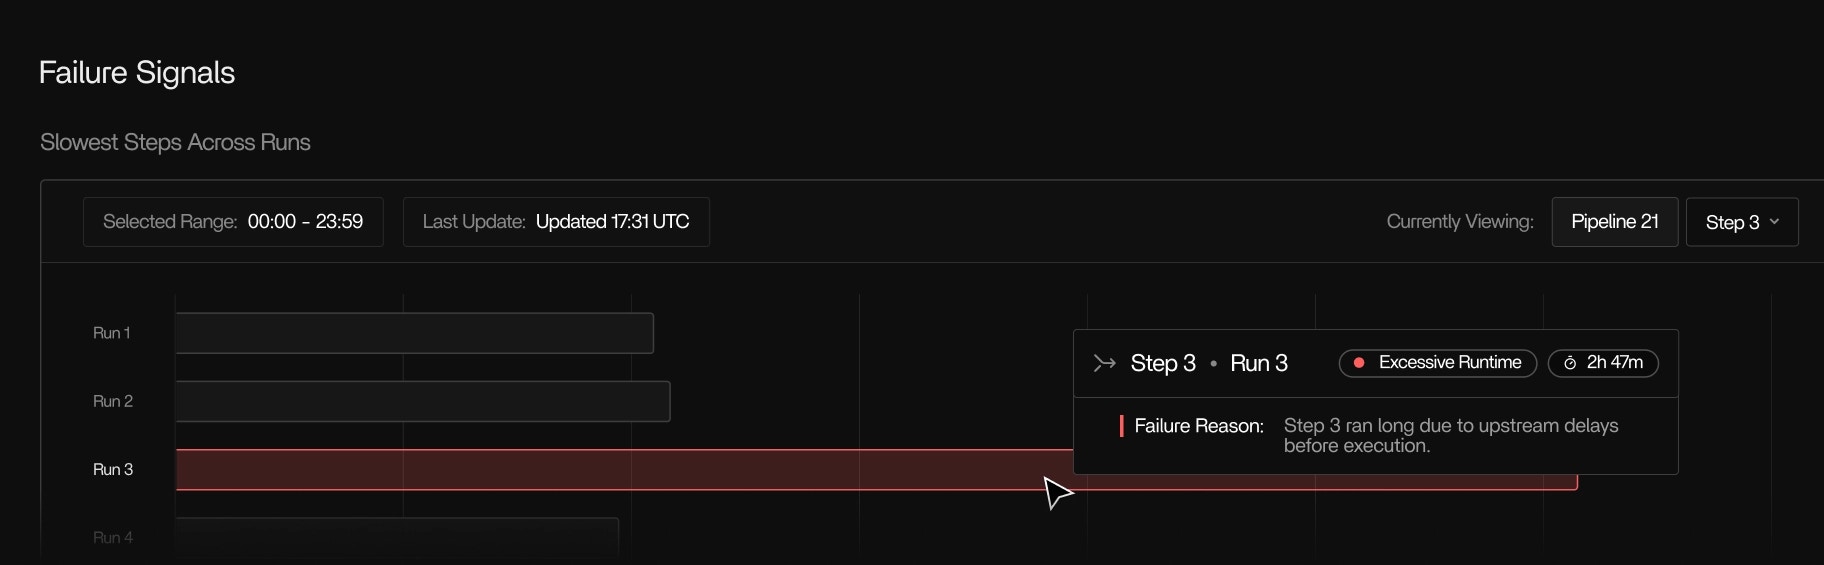
- Accurate OOM kills
- Tools that start but make no progress
- Unusually long I/O wait
- Unusually long Network I/O wait
- Steps that run significantly slower than typical
Root-cause insights
Cost optimization
Cost and usage tracking
- Pipeline
- Run
- Step
- Tool
- Instance
- User
- Cost center
AWS is currently the main cost integration; GCP telemetry is supported.
Instance rightsizing
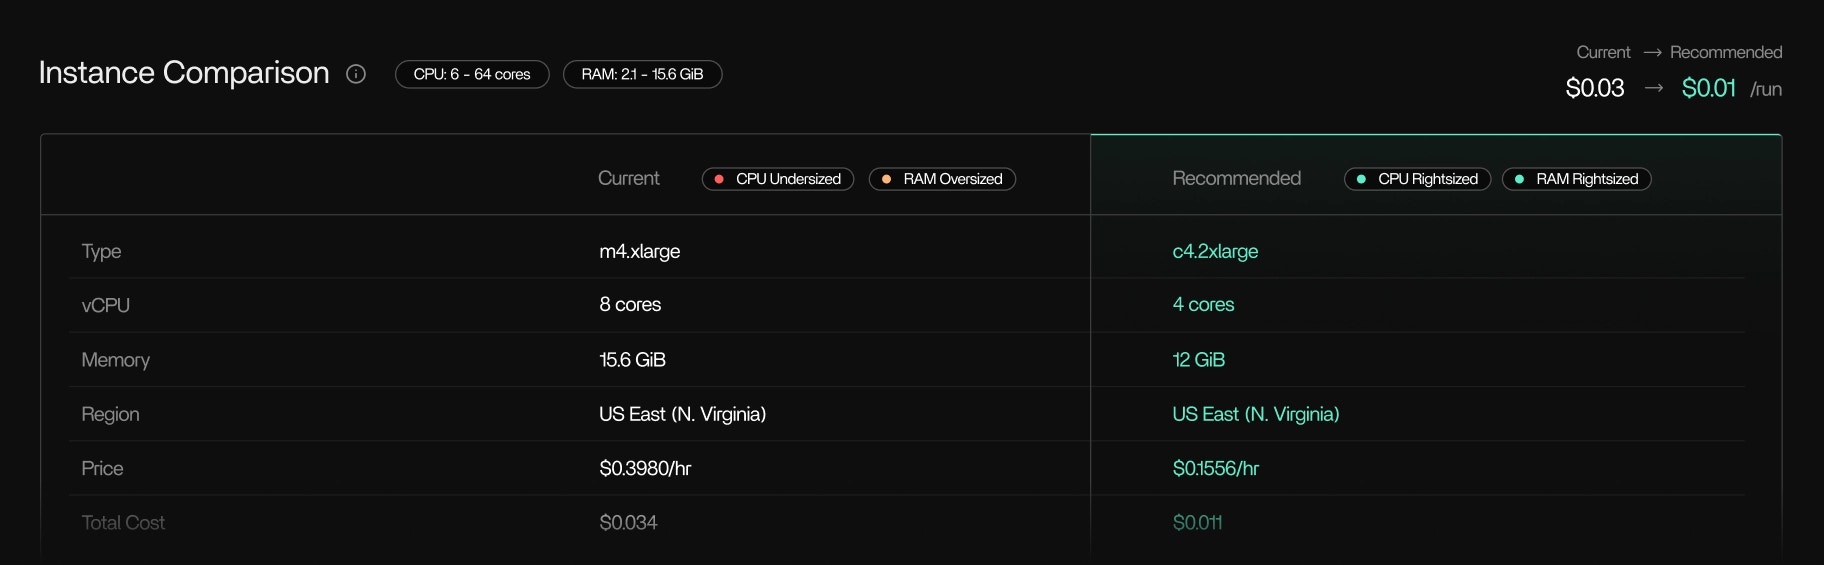
Regional and instance family optimizations
Tracer will recommend instance families that suit your task better and regions that support them. Tracer will also recommend cost optimizations across on-demand and spot pricing that’s optimized by region.Recommendations are based only on observed runtime behavior.
Idle resource detection
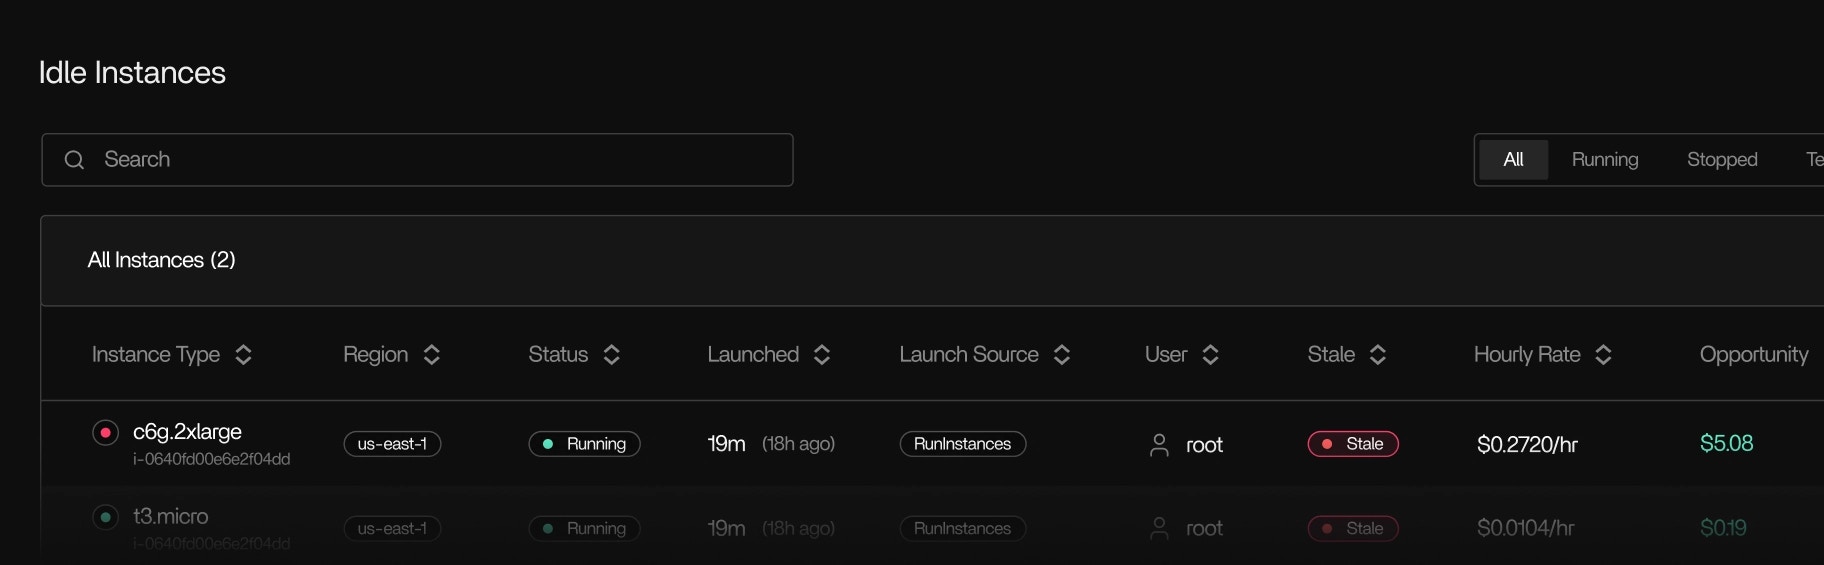
- Active EC2 nodes that aren’t doing any work
- Batch workers stuck idle
- Instances with negligible CPU activity over time
Compatibility
Framework and cloud support
Tracer is framework agnostic and works with all the frameworks you use:- Nextflow
- Snakemake
- CWL
- Argo
- Custom scripts
- AWS Batch
- EC2-based compute
- GCP (telemetry)
- On-prem Linux environments
- And many others
Because Tracer runs at the kernel-level, you don’t need any configuration for any of these systems, it all just works straight-out-of-the-box.
Real-world environments
Tracer is built to handle the complexity of production scientific computing environments. Whether you’re running on cloud infrastructure, on-premises clusters, or a hybrid of both, Tracer adapts to your setup. Tracer supports:- Mixed cloud and on-prem environments
- Legacy tools and custom binaries
- Pipelines with many short-lived steps
- Custom AMIs and machine images
- Containerized and non-containerized workloads
- Batch processing systems
- Interactive compute sessions
Security and performance
Security model
All your data is safe and secure as Tracer does not inspect or collect:- Input data
- Output data
- Sample or patient data
- Code
- Environment variables
- Secrets
- System-level performance telemetry
- Tool and process metadata
- Cloud cost and usage identifiers (From your Cloud provider)
Overhead
Tracer’s eBPF-based collection runs inside the kernel with negligible overhead. The agent is designed to have minimal impact on your pipeline’s performance, even when monitoring complex, multi-step workflows with thousands of subprocesses.You do not need to re-run pipelines to obtain telemetry.
- eBPF probes execute in kernel space with nanosecond-level latency
- No modification to your application code or binaries
- Constant memory footprint regardless of pipeline complexity
- Zero network overhead for local telemetry collection