

What Tracer/tune does
Tracer/tune analyzes how pipelines actually ran and translates that behavior into actionable guidance. Specifically, it:- Reconstructs execution at the level of pipelines, runs, steps, tools, and subprocesses
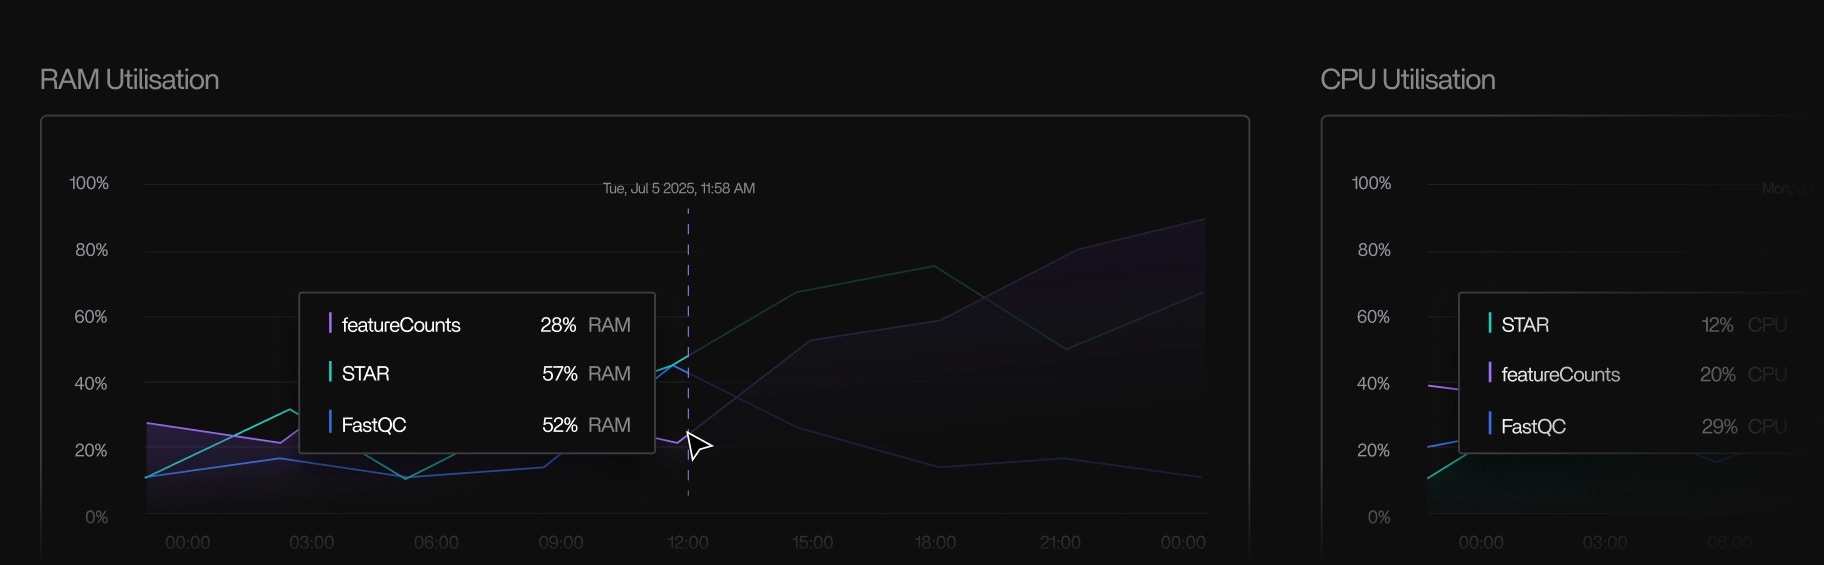
- Visualizes real CPU, memory, disk, and network usage over time
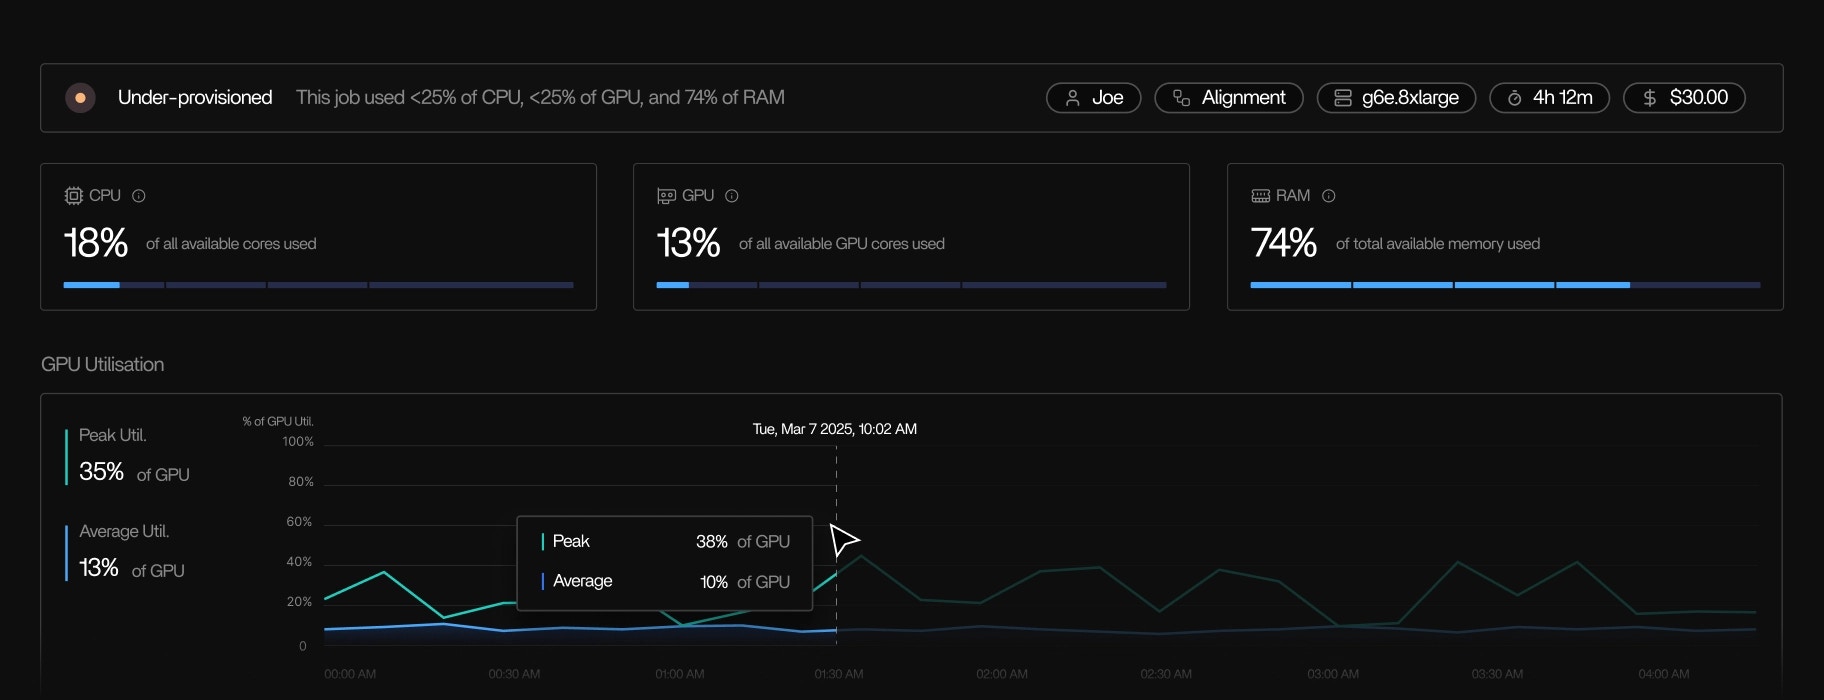
- Identifies bottlenecks, idle execution, and over-allocation
- Produces right-sizing and optimization recommendations grounded in runtime data
What Tracer/tune is optimized for
Tracer/tune is designed for teams with pipelines that fail or already run successfully but are inefficient, unstable, or expensive.Repeatability
Understand patterns across many runs, not single outliers
Bottleneck diagnosis
Pinpoint what actually limits progress
Right-sizing
Align resources with observed usage
Stability
Reduce retries, stalls, and intermittent failures
Regression tracking
Detect performance drift over time
These problems are difficult to solve with logs, dashboards, or orchestration metadata alone.
How Tracer/tune produces recommendations
Tracer/tune operates entirely on execution signals derived from the host-layer.Inputs
Tracer/tune analyzes:- CPU utilization and scheduling behavior
- Memory usage, peak memory, and pressure
- Disk and network I/O throughput and wait time
- Idle execution and blocked subprocesses
- Variance in resource usage across runs and steps
Outputs
Based on these observations, Tracer/tune produces recommendations such as:- Lowering CPU or memory requests for underutilized steps
- Increasing peak memory to prevent OOM retries
- Changing storage type or data locality for I/O-bound stages
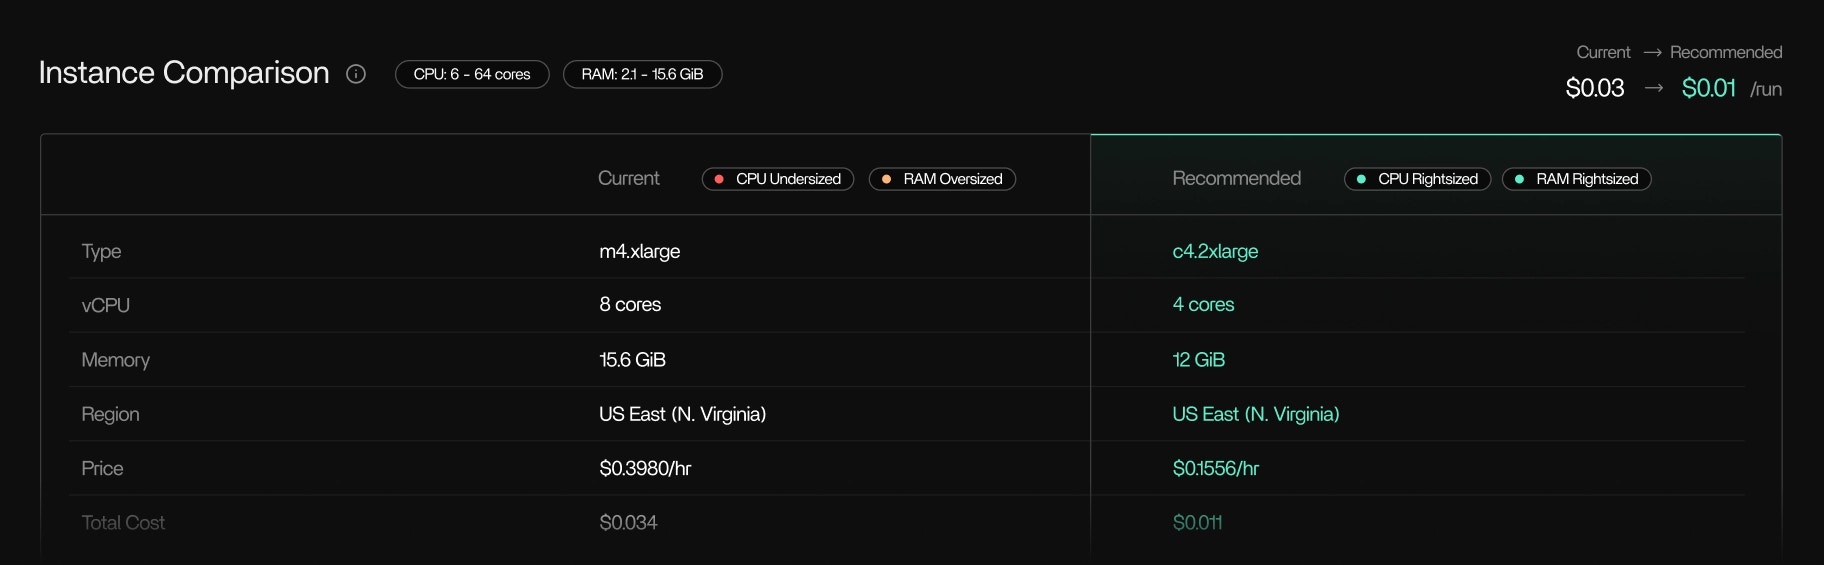
- Selecting more appropriate instance or node families
- Highlighting steps that stall, make no forward progress, or run abnormally slow
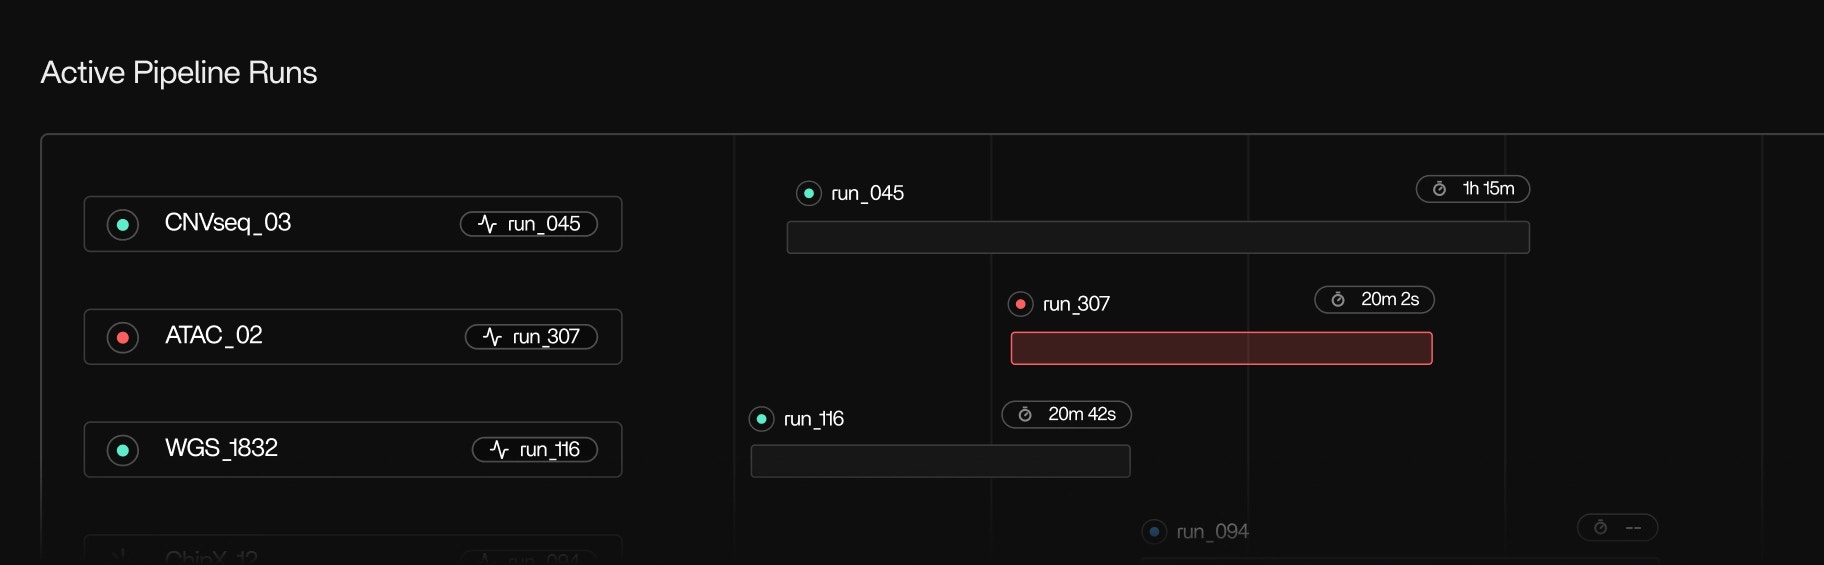
What you see in the Tracer UI
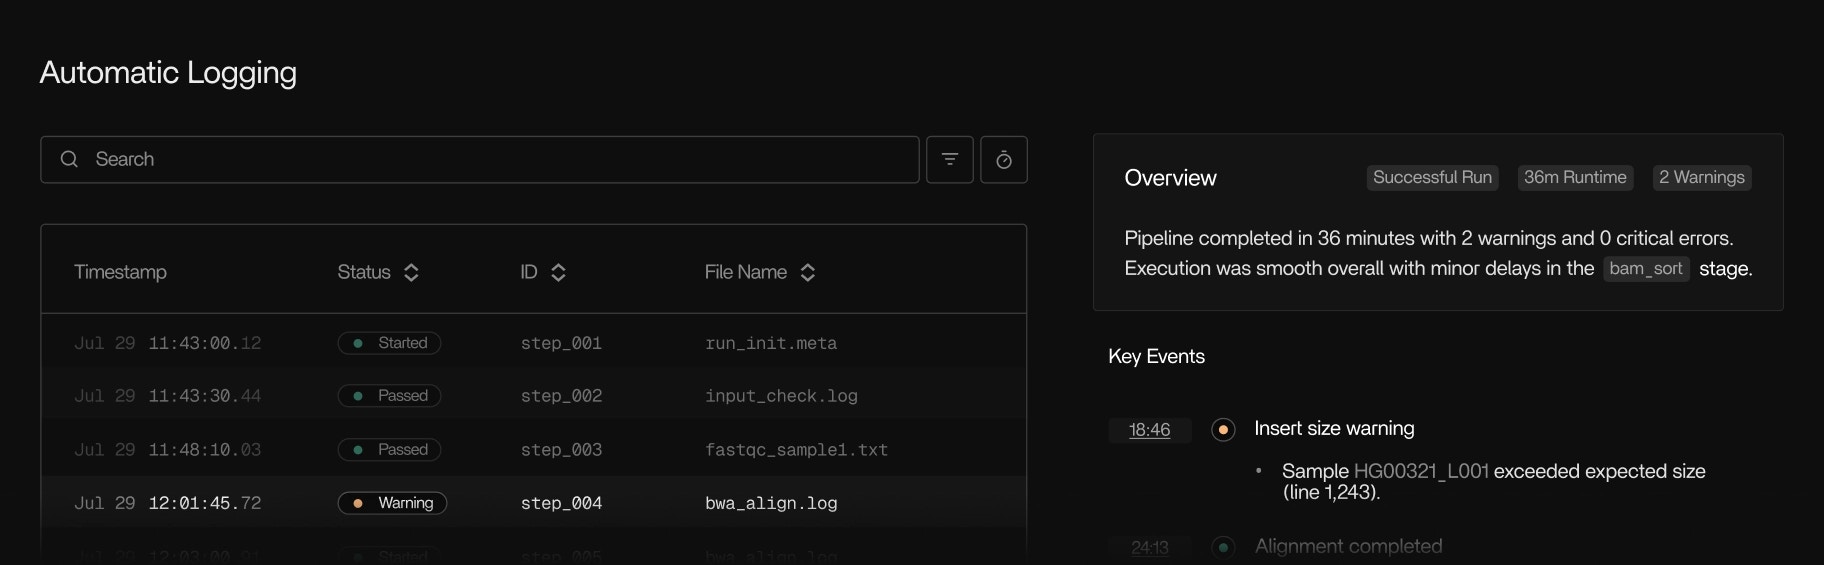
Tracer/tune is driven by a shared execution view in the Tracer UI. You can:- Follow pipeline runs in real time, step by step
- See which tools and subprocesses are active, queued, or stalled
- Inspect resource usage over time for each step or tool
- Compare behavior across runs to identify regressions or improvements
- Understand how work is distributed across nodes and instances
Examples
These examples are framework-agnostic and apply across workflow engines and environments.CPU underutilization
A step requests many cores but consistently uses only a small fraction. → Tracer/tune recommends lowering CPU allocation without affecting runtime.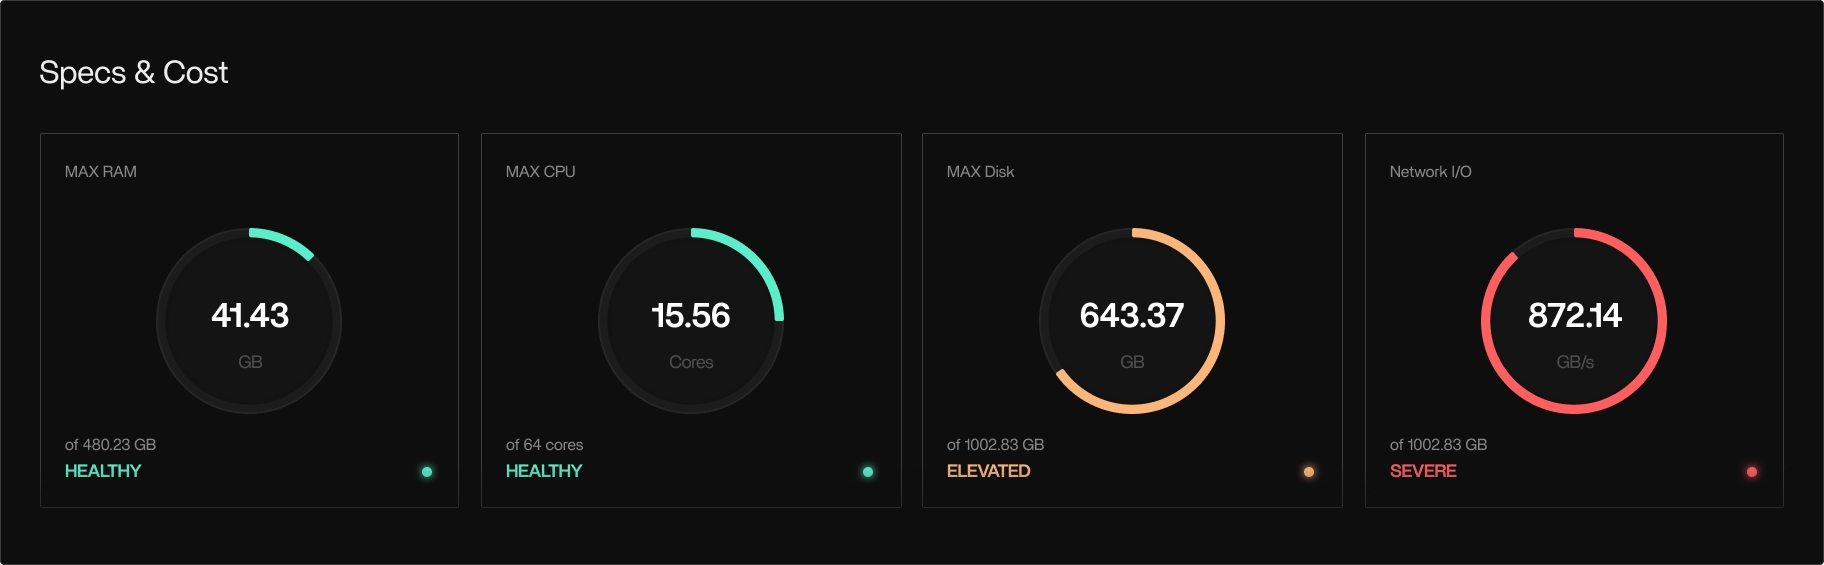
High I/O wait
A task spends most of its time blocked on disk or network I/O. → Tracer/tune recommends storage or locality changes, not additional cores.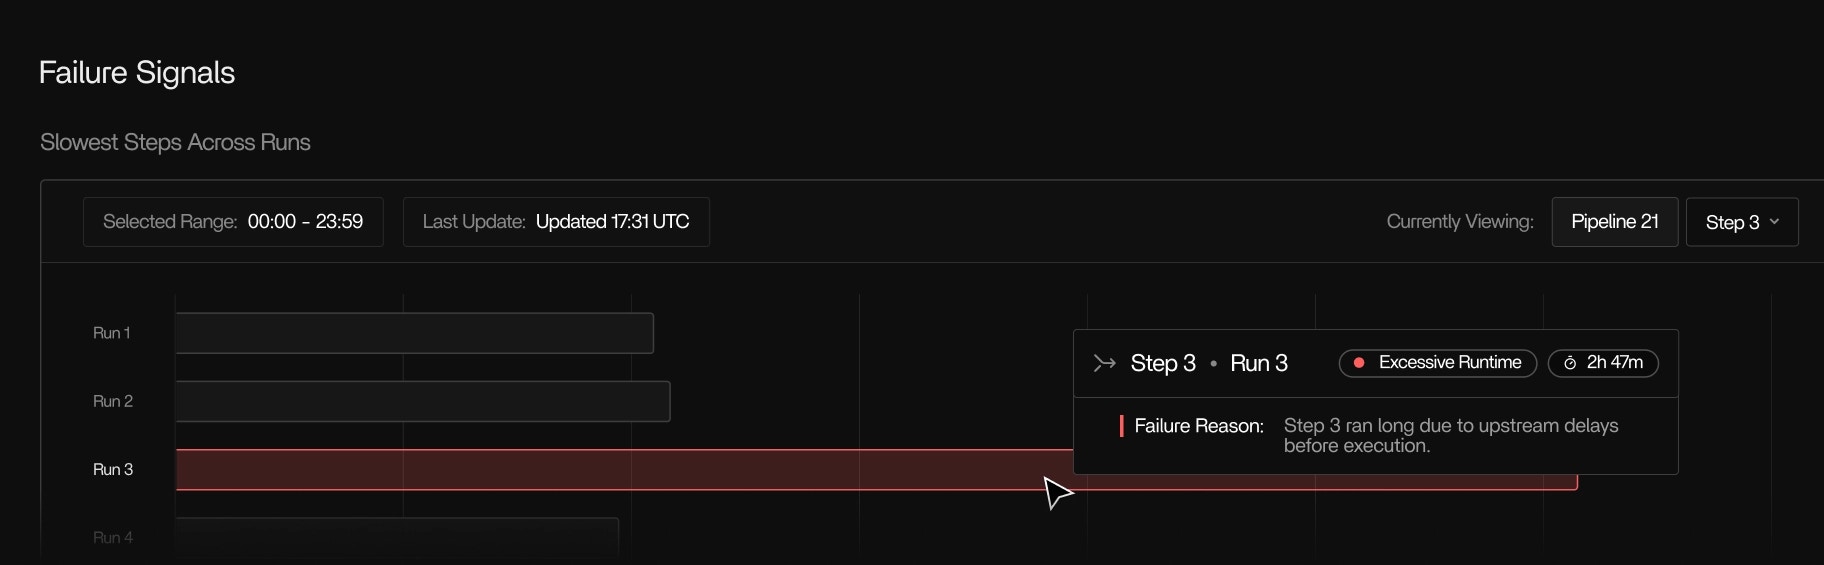
Memory spikes and retries
A step occasionally exceeds memory limits and retries. → Tracer/tune recommends right-sizing peak memory to stabilize execution. In each case, the recommendation is tied directly to observed runtime behavior.Cost-aware optimization
Tracer/tune links execution behavior to actual cloud cost. It:- Breaks down usage and cost by pipeline, run, step, tool, and instance
- Uses cloud-provider billing metrics for accurate cost attribution
- Highlights over-provisioned resources that drive unnecessary spend
- Supports instance rightsizing and instance family recommendations
What Tracer/tune does not replace
Tracer/tune provides process-level execution truth. For code-level optimization, it complements traditional profilers rather than replacing them.Requirements
Tracer/tune requires Tracer/collect to be installed and running. It supports:- AWS Batch and other Linux-based cloud compute
- On-prem and hybrid HPC environments
- Containerized and non-containerized workloads
- Any workflow engine, scheduler, language, or binary supported by Tracer/collect